> ## Documentation Index
> Fetch the complete documentation index at: https://docs.specterops.io/llms.txt
> Use this file to discover all available pages before exploring further.
# Troubleshooting
Nemesis has a number of services to help with assist with troubleshooting.
**Note** that Grafana + Jaeger tracing are only available if you use the `--monitoring` flag when launching Nemesis!
## Grafana
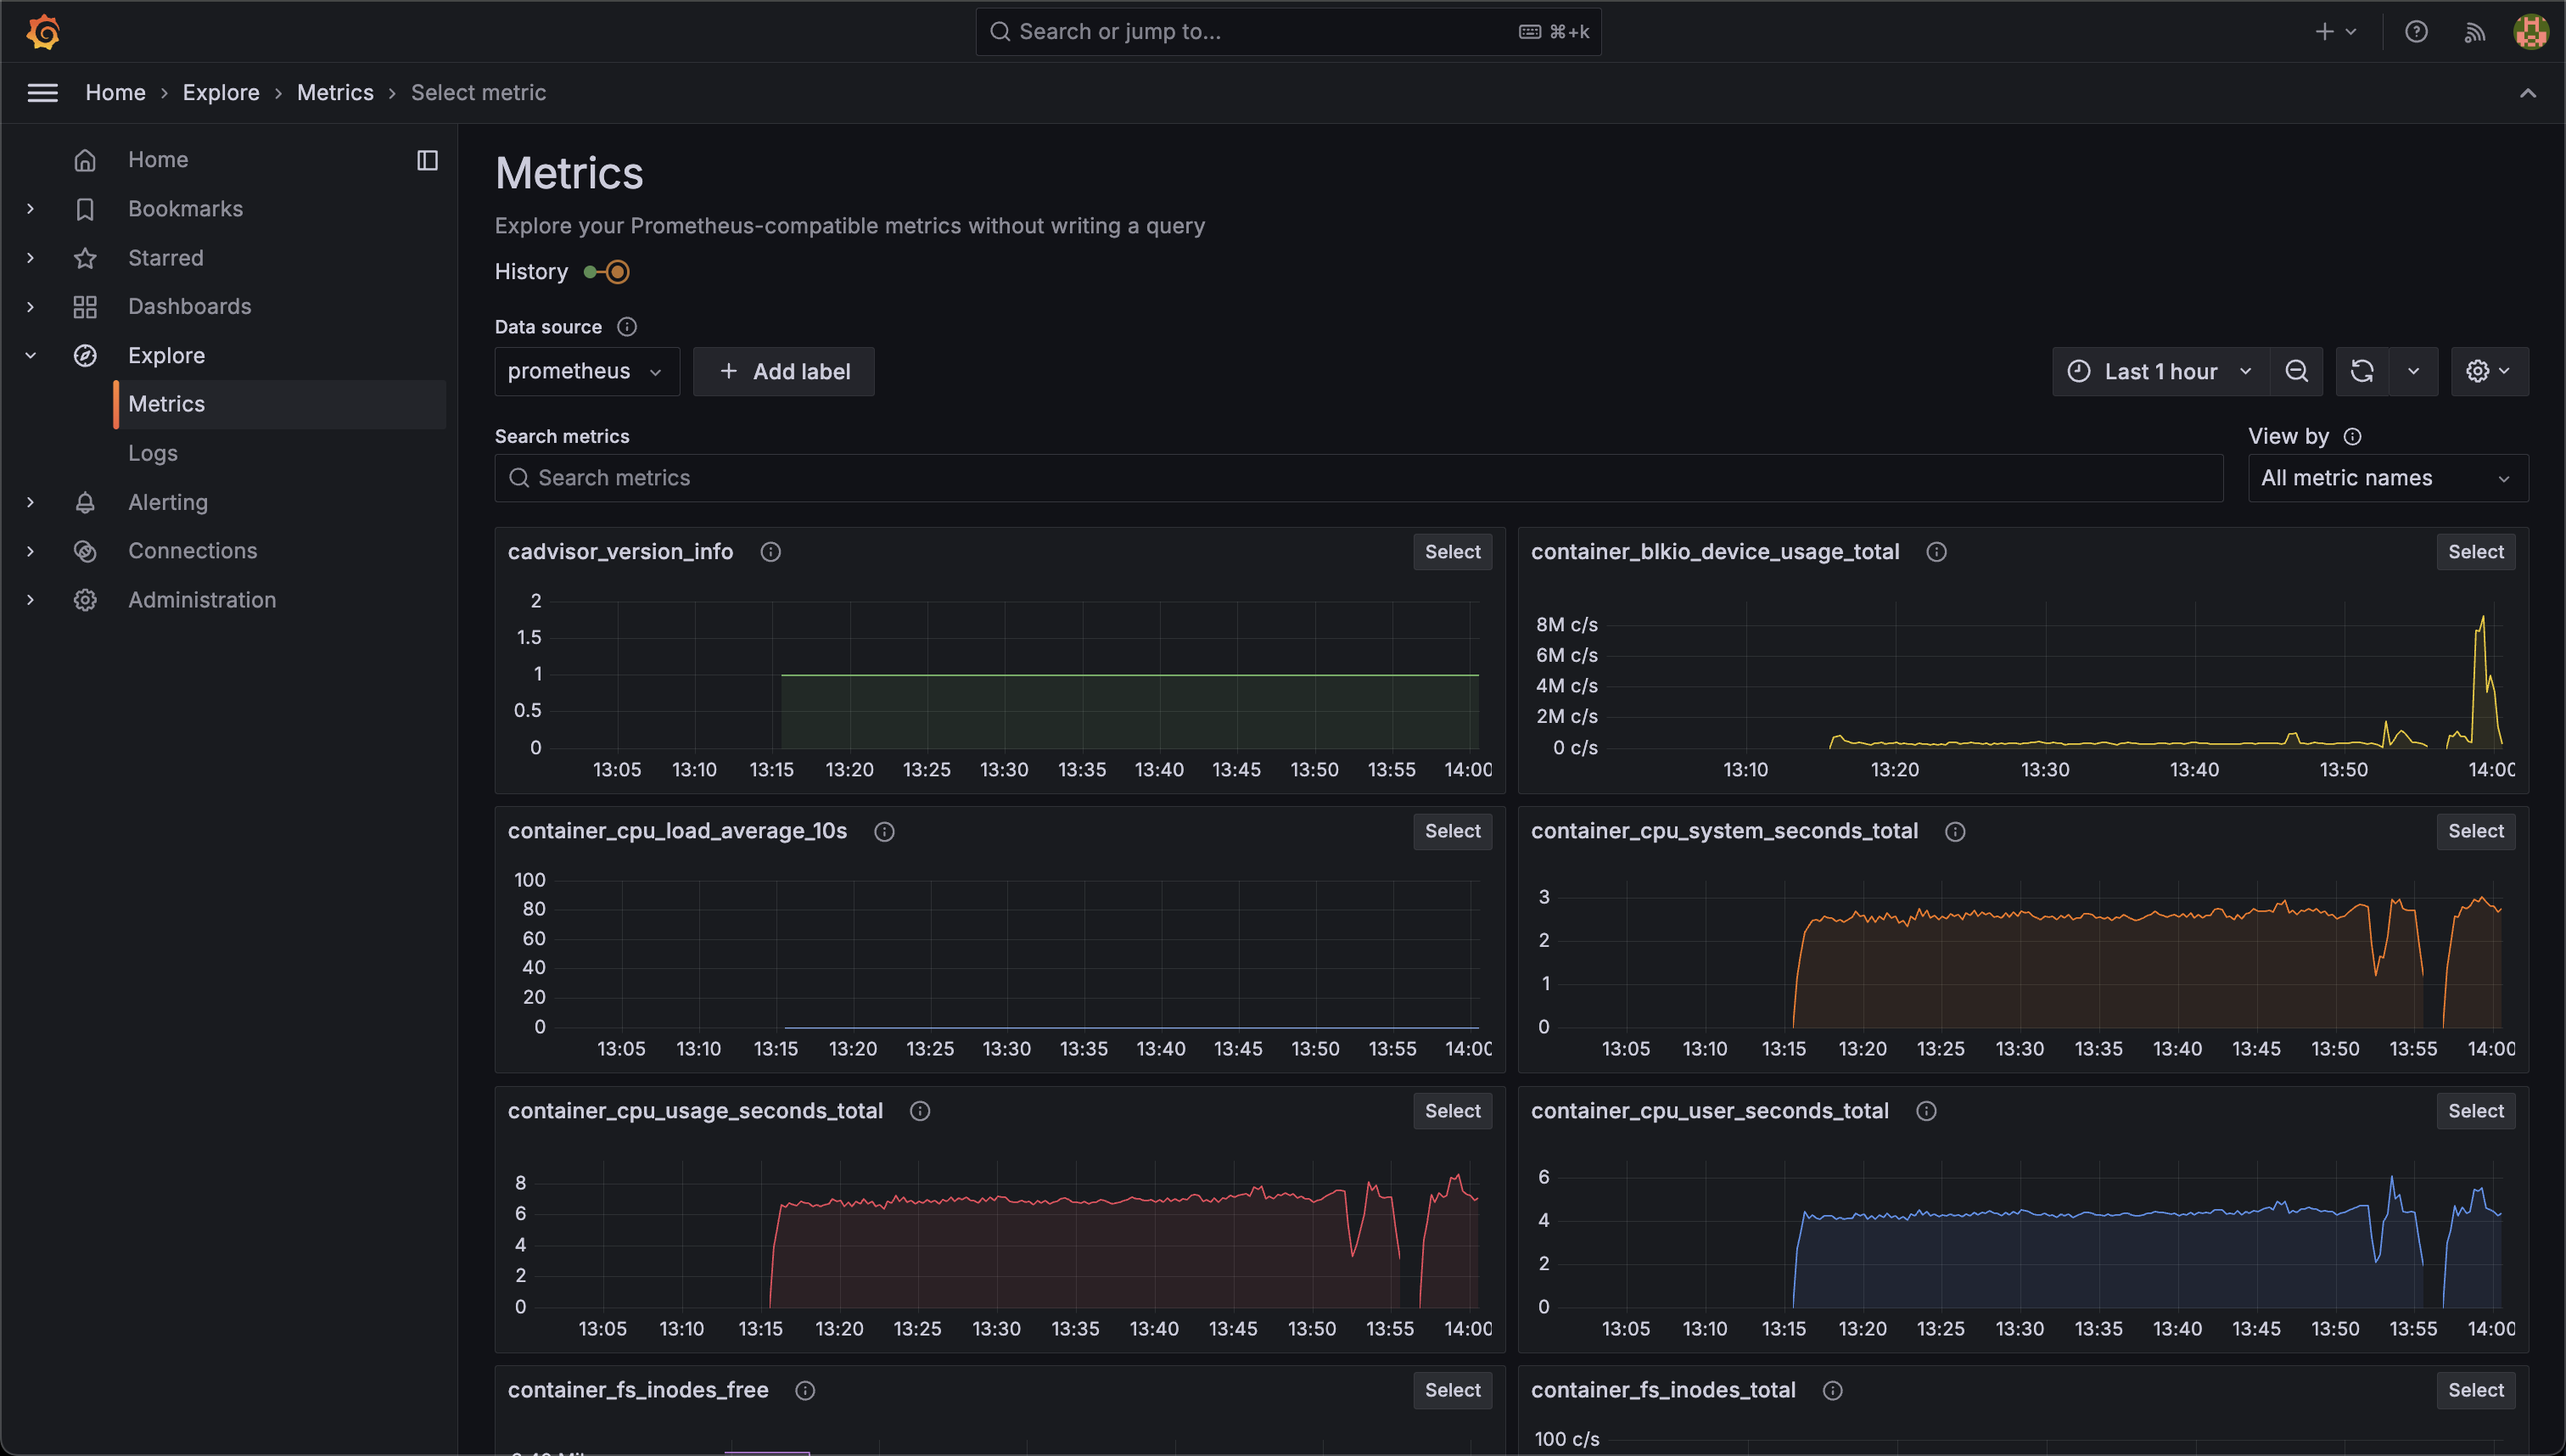
Navigating to the **Help** menu reachable in the bottom left of the Nemesis interface and clicking the `/grafana/` route link will take you to the Grafana interface. Clicking the **Metrics** Grafana link on the Help page will take you to the general metrics visualization:
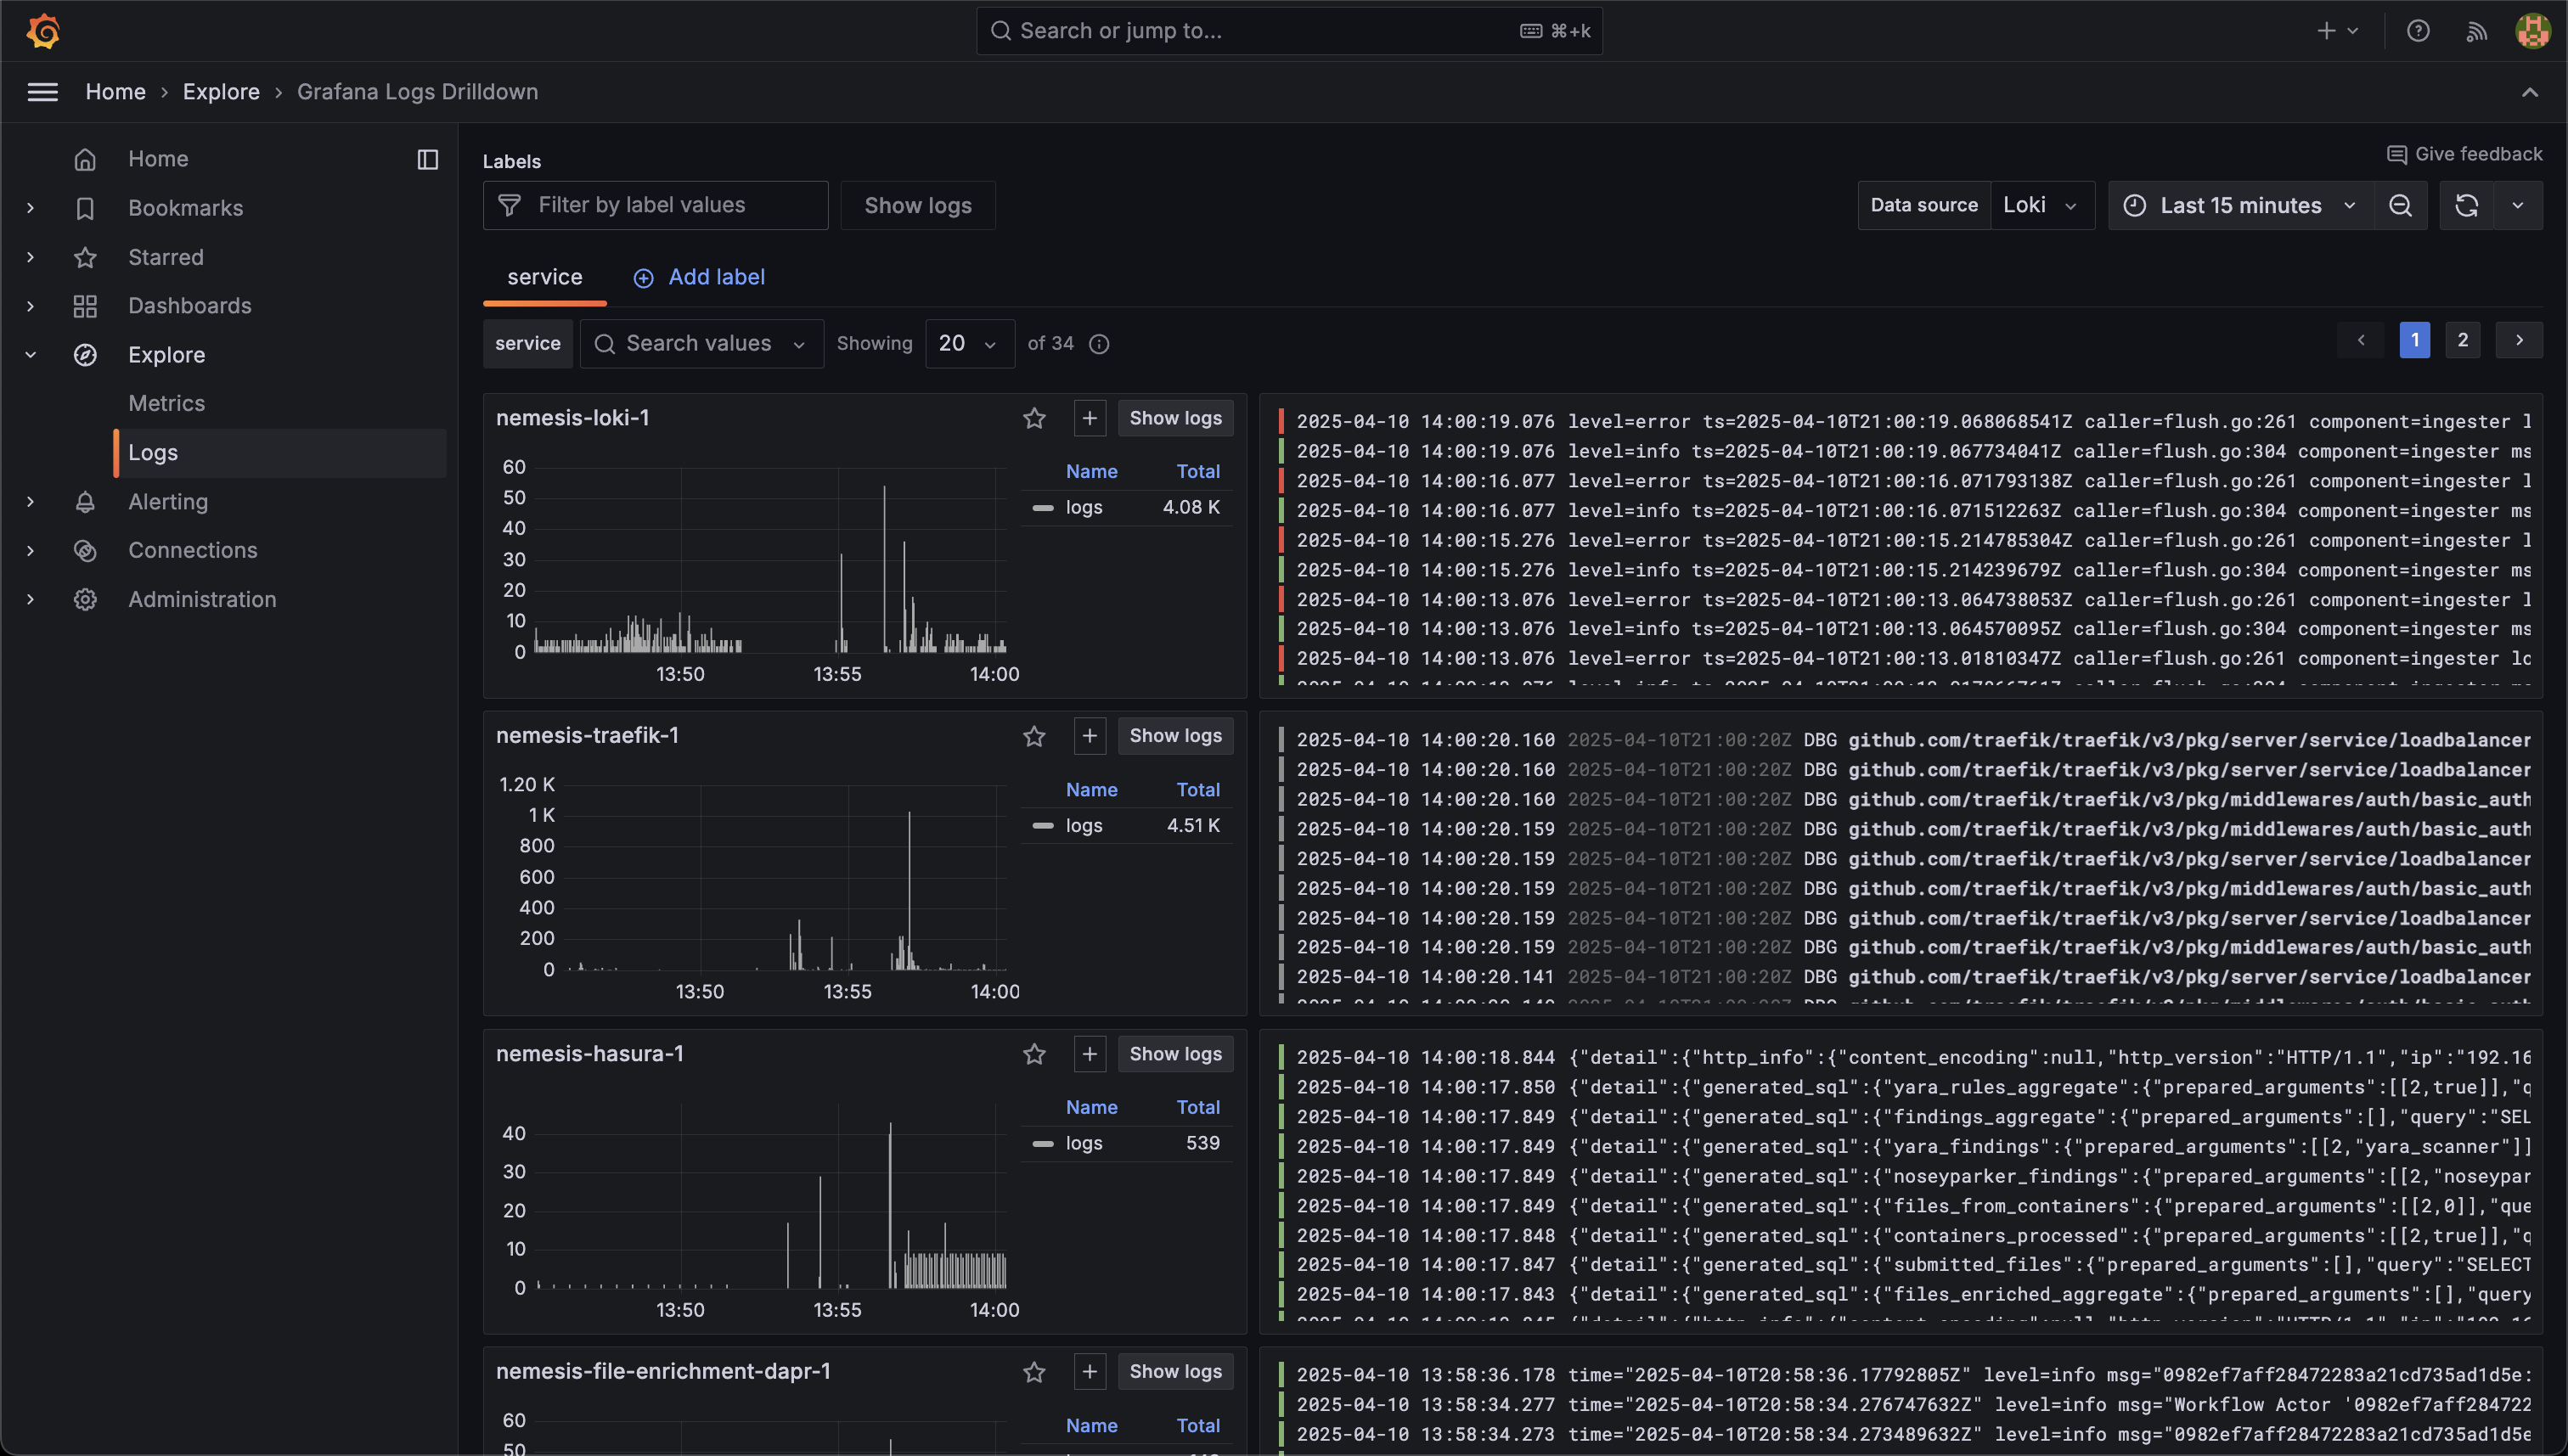
 Clicking the **Logs** Grafana link on the Help page will take you to the general logs Loki idexing in Grafana:
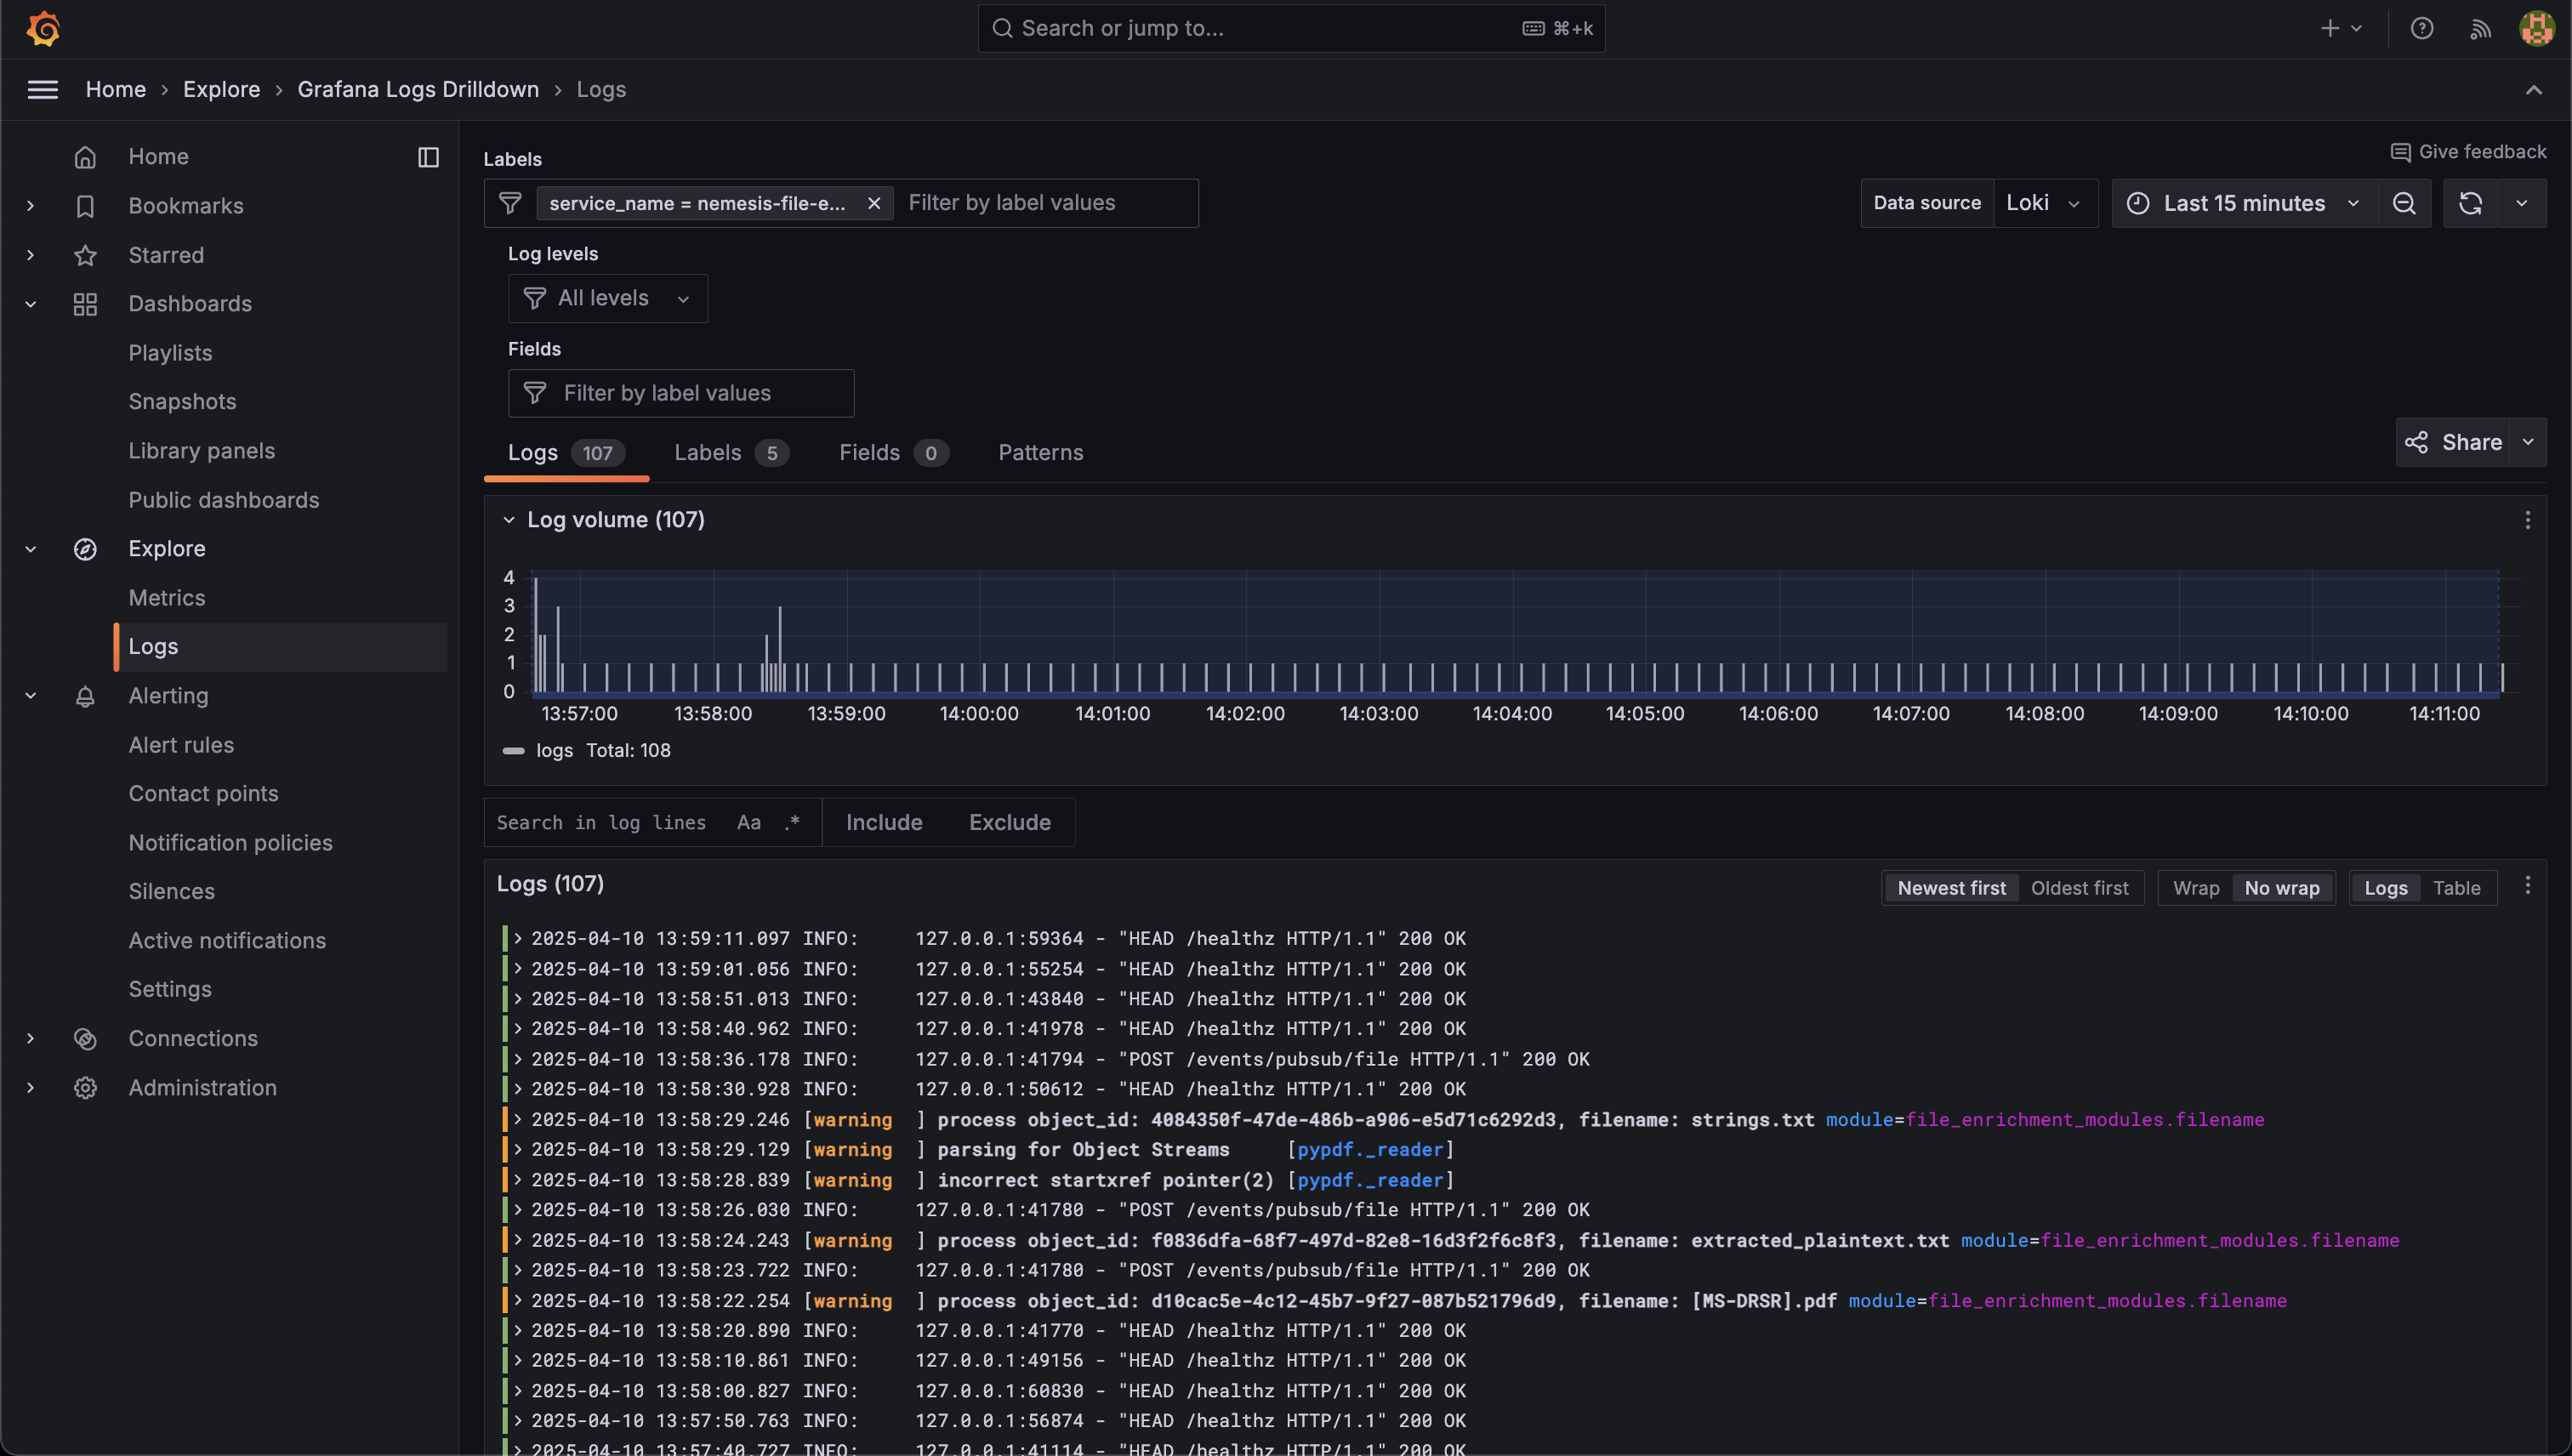
 Filtering by a specific service name will allow you to drill down into the logging for that service, which can easily be searched, for example with the `nemesis-file-enrichment` service:
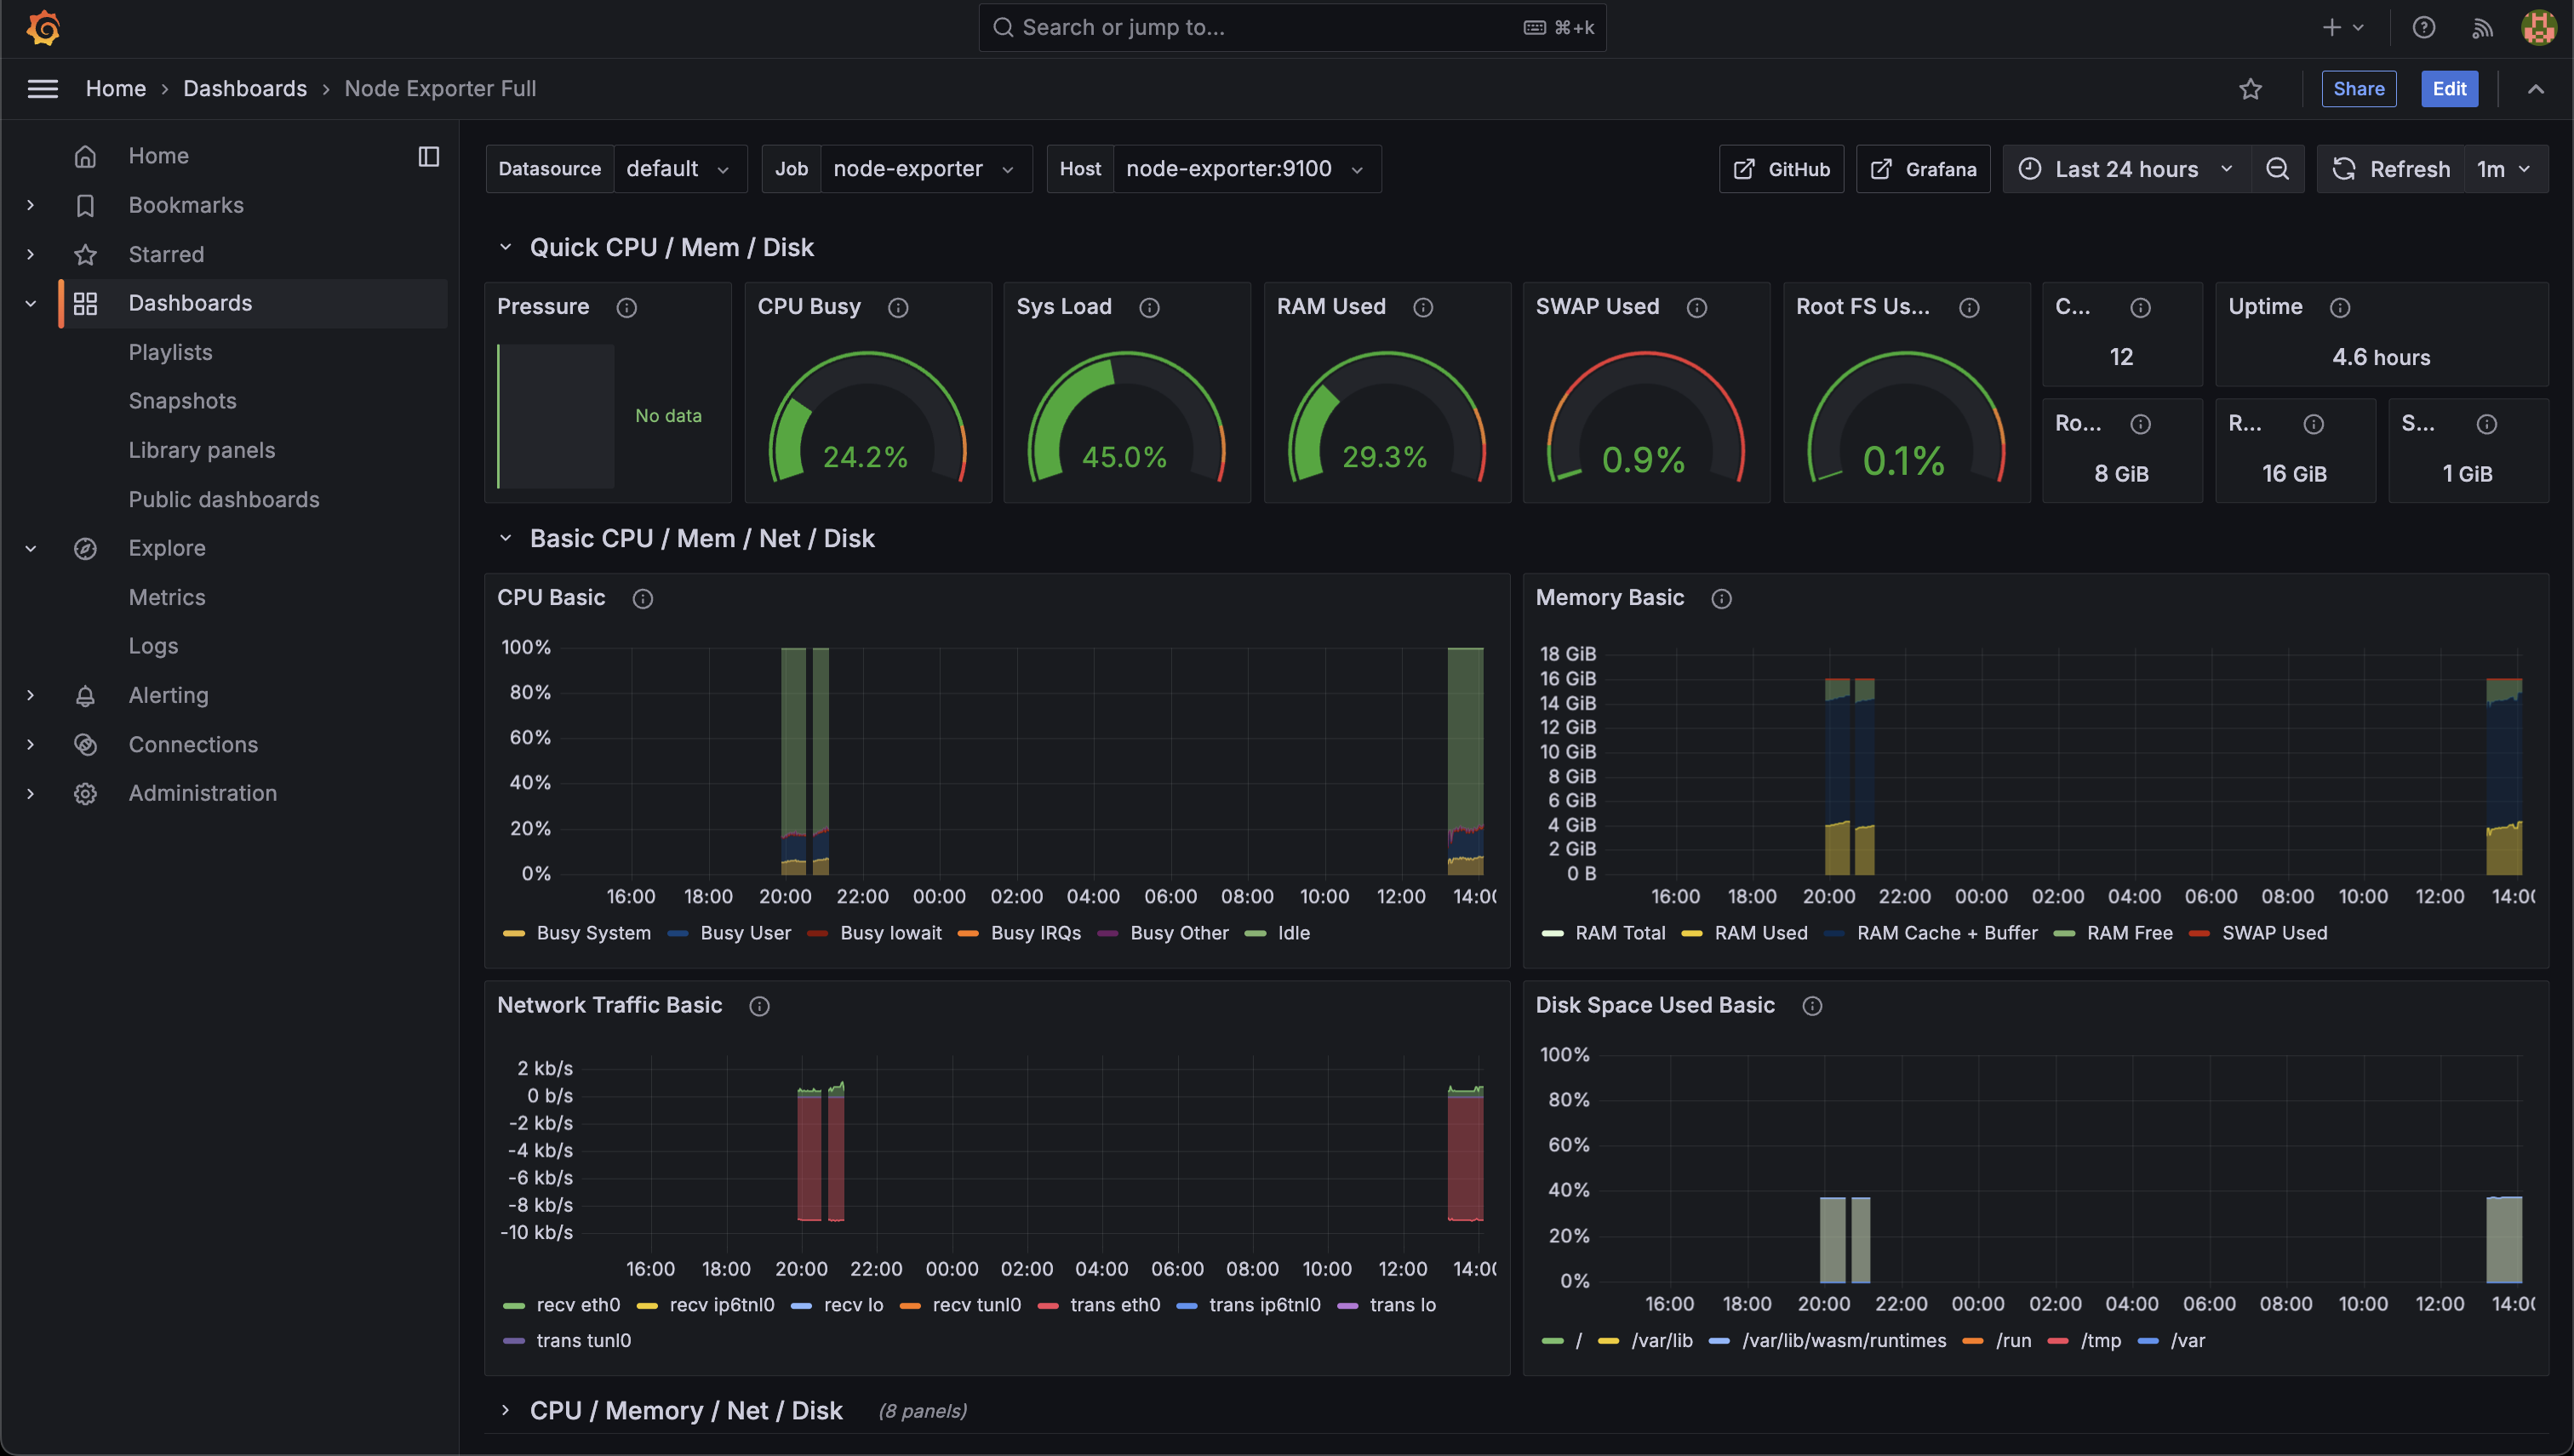
 Clicking the dashboards link in Grafana will bring you to a few preconfigured dashboards as well:
 ## RabbitMQ Dashboard
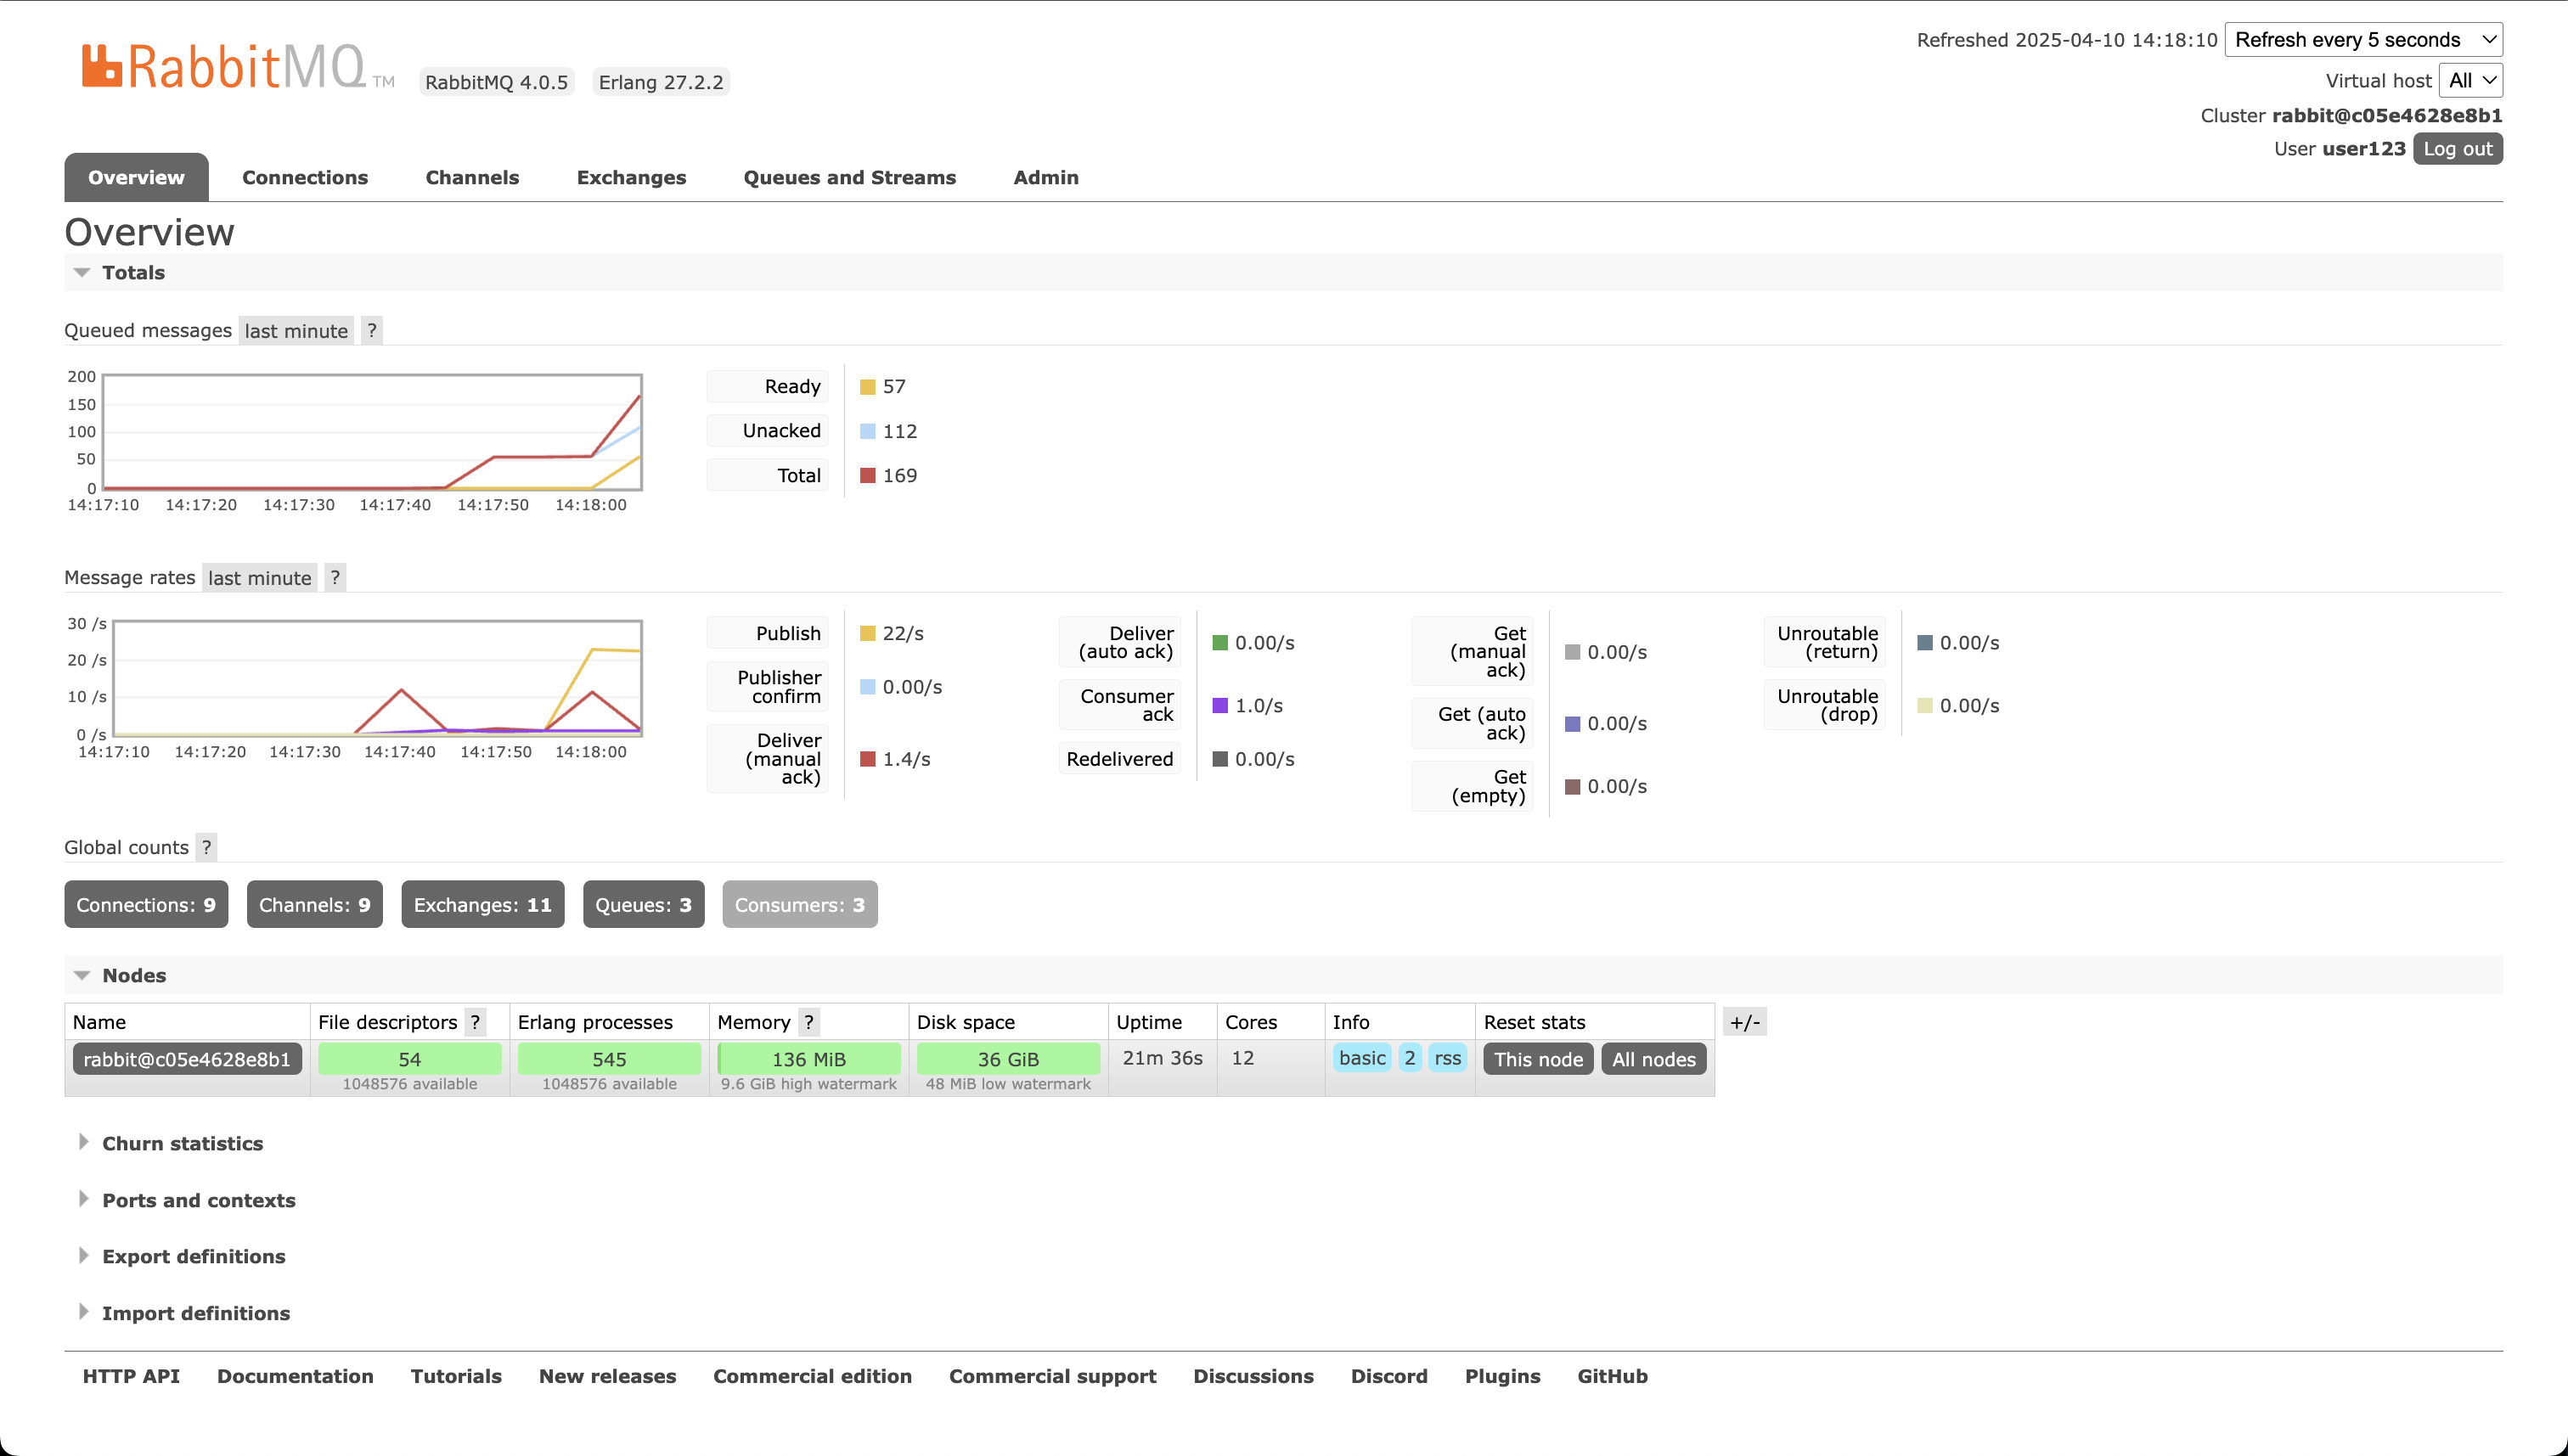
While the queueing system for Nemesis is swappable with Dapr, Nemesis currently uses RabbitMQ. Navigating to the **Help** menu reachable in the bottom left of the Nemesis interface and clicking the `/rabbitmq/` route link will take you to the RabbitMQ interface. This interface can be used to track message delivery rates/etc.
## RabbitMQ Dashboard
While the queueing system for Nemesis is swappable with Dapr, Nemesis currently uses RabbitMQ. Navigating to the **Help** menu reachable in the bottom left of the Nemesis interface and clicking the `/rabbitmq/` route link will take you to the RabbitMQ interface. This interface can be used to track message delivery rates/etc.
 ## Jaeger Tracing
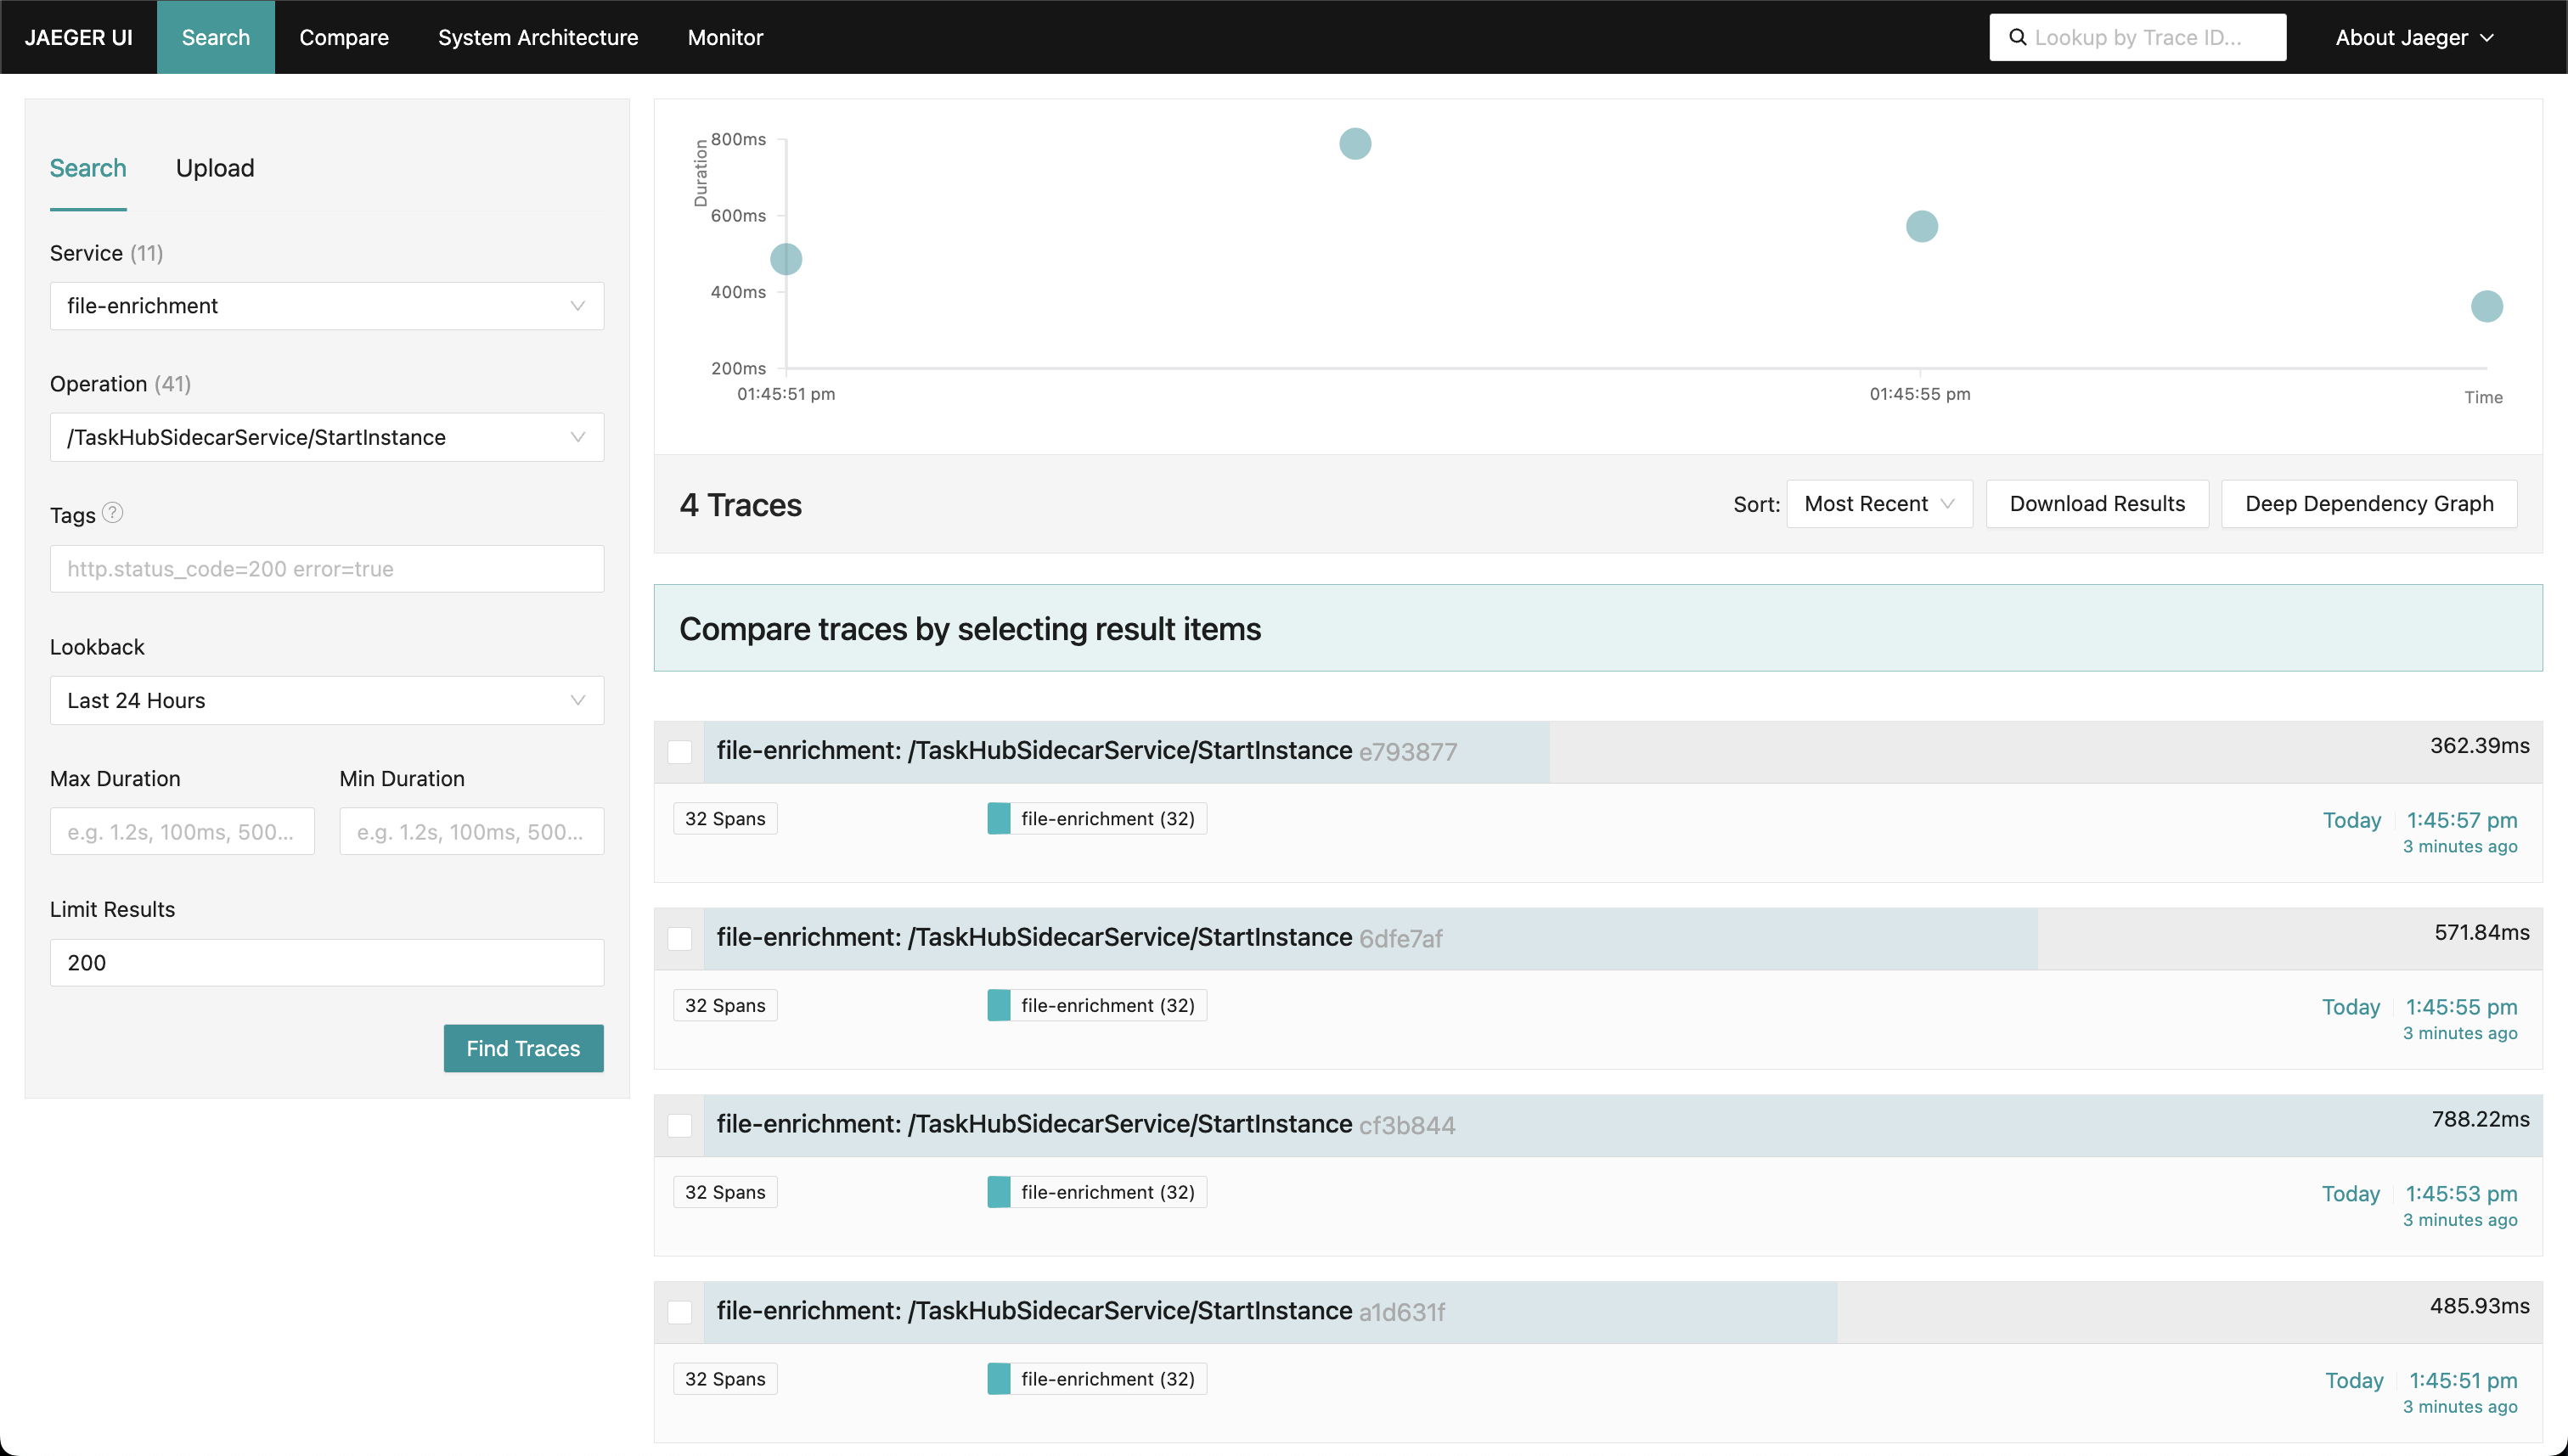
Navigating to the **Help** menu reachable in the bottom left of the Nemesis interface and clicking the `/jaeger/` route link will take you to the Jaeger tracing interface. Reaching Jaeger via this link will filter for the `file-enrichment: /TaskHubSidecarService/StartInstance` trace type by default (the Dapr file\_enrichment workflow trace):
## Jaeger Tracing
Navigating to the **Help** menu reachable in the bottom left of the Nemesis interface and clicking the `/jaeger/` route link will take you to the Jaeger tracing interface. Reaching Jaeger via this link will filter for the `file-enrichment: /TaskHubSidecarService/StartInstance` trace type by default (the Dapr file\_enrichment workflow trace):
 Clicking a trace will give you more information on the trace:
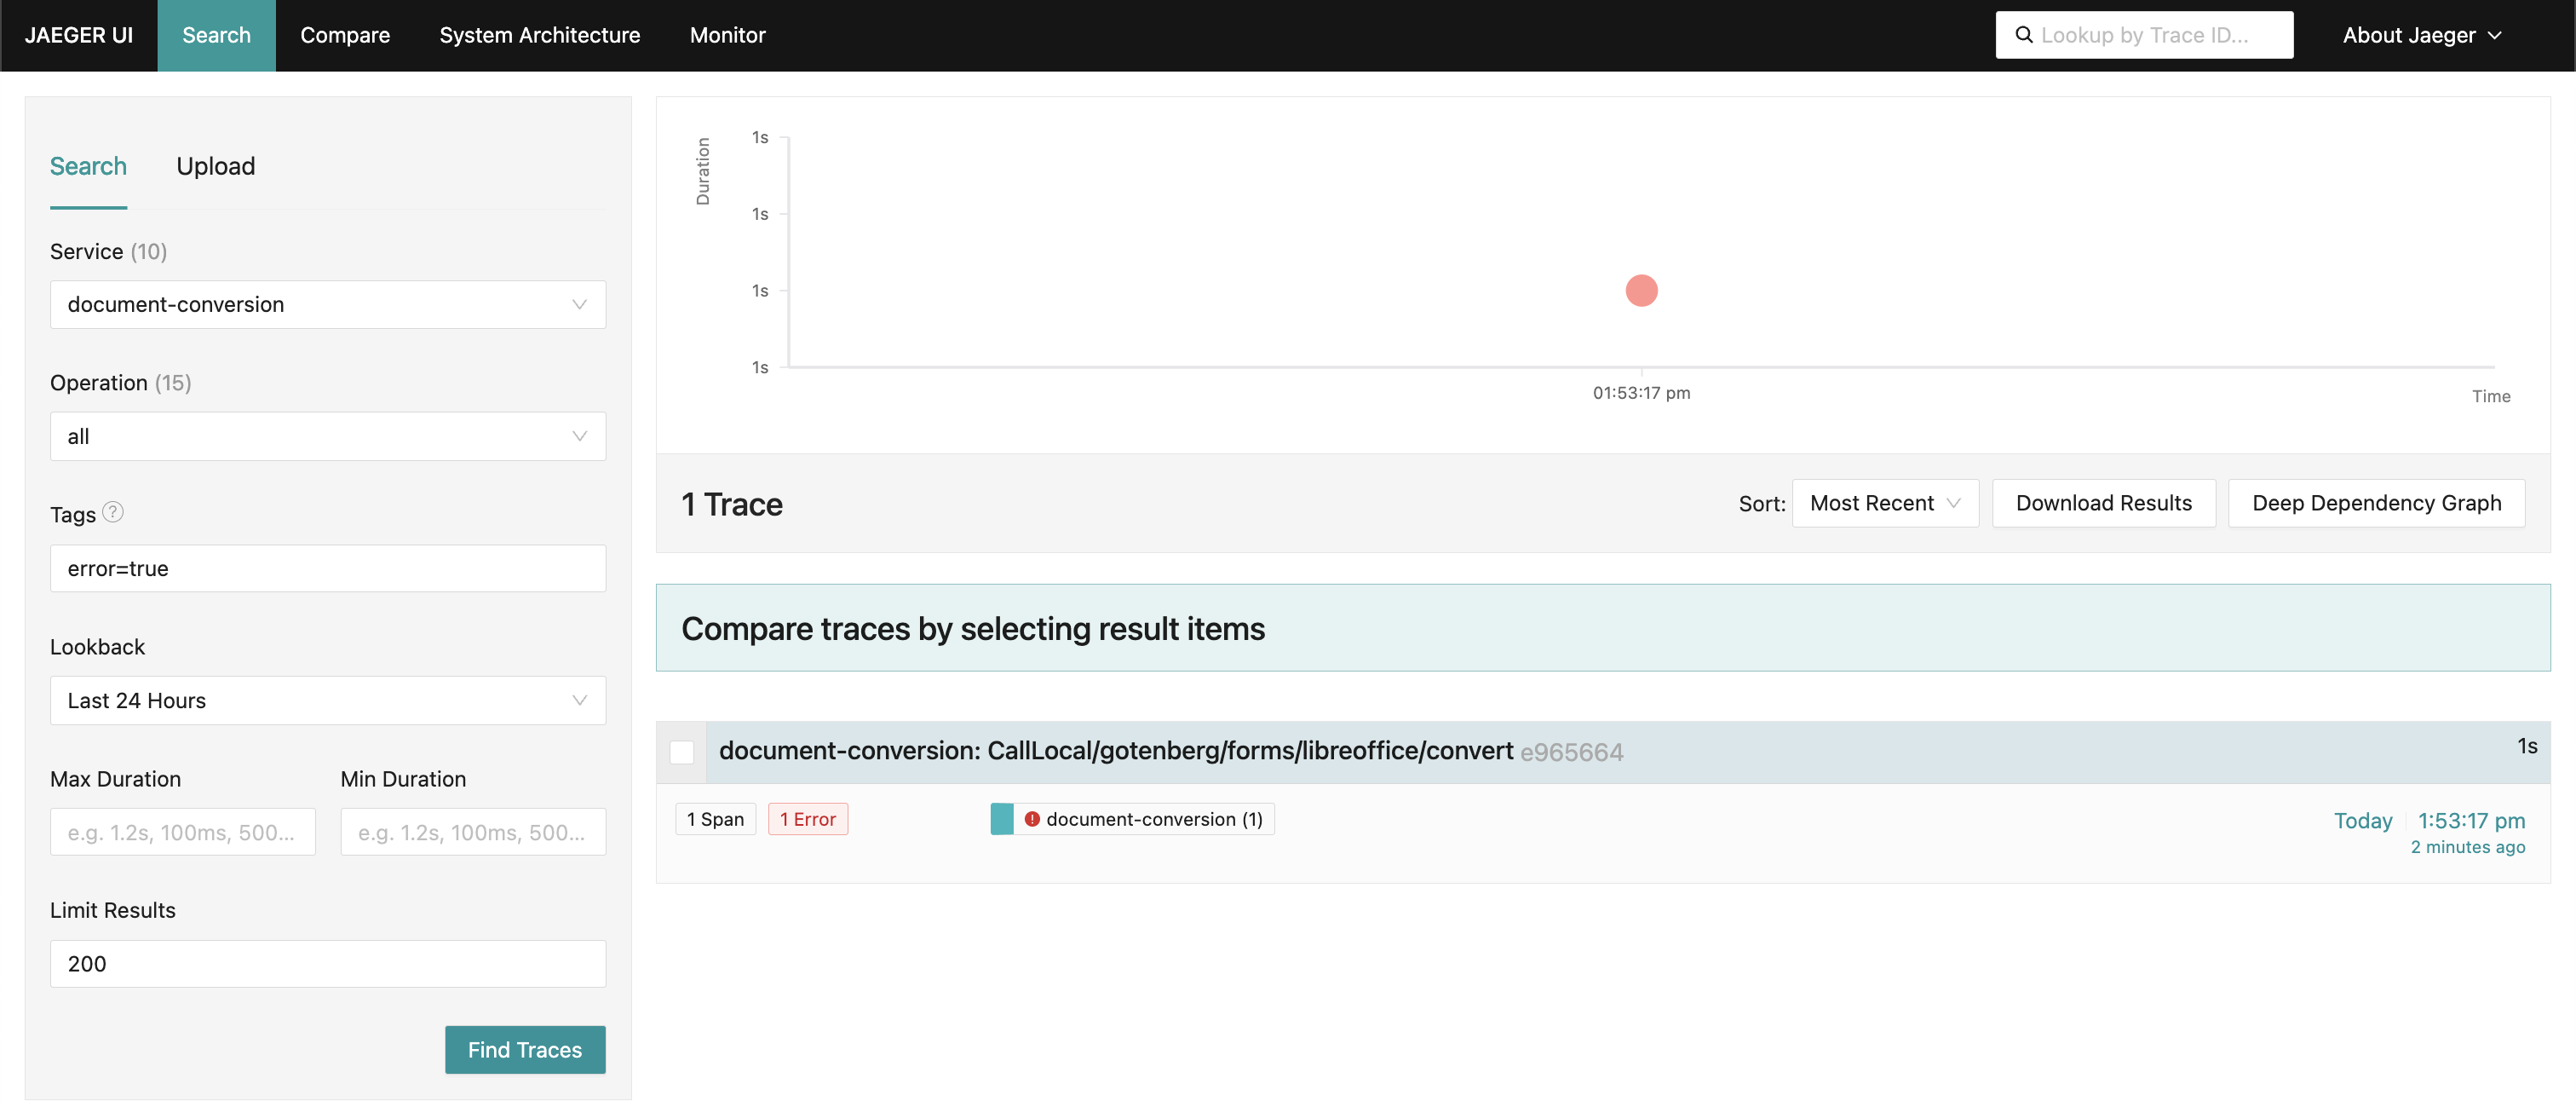
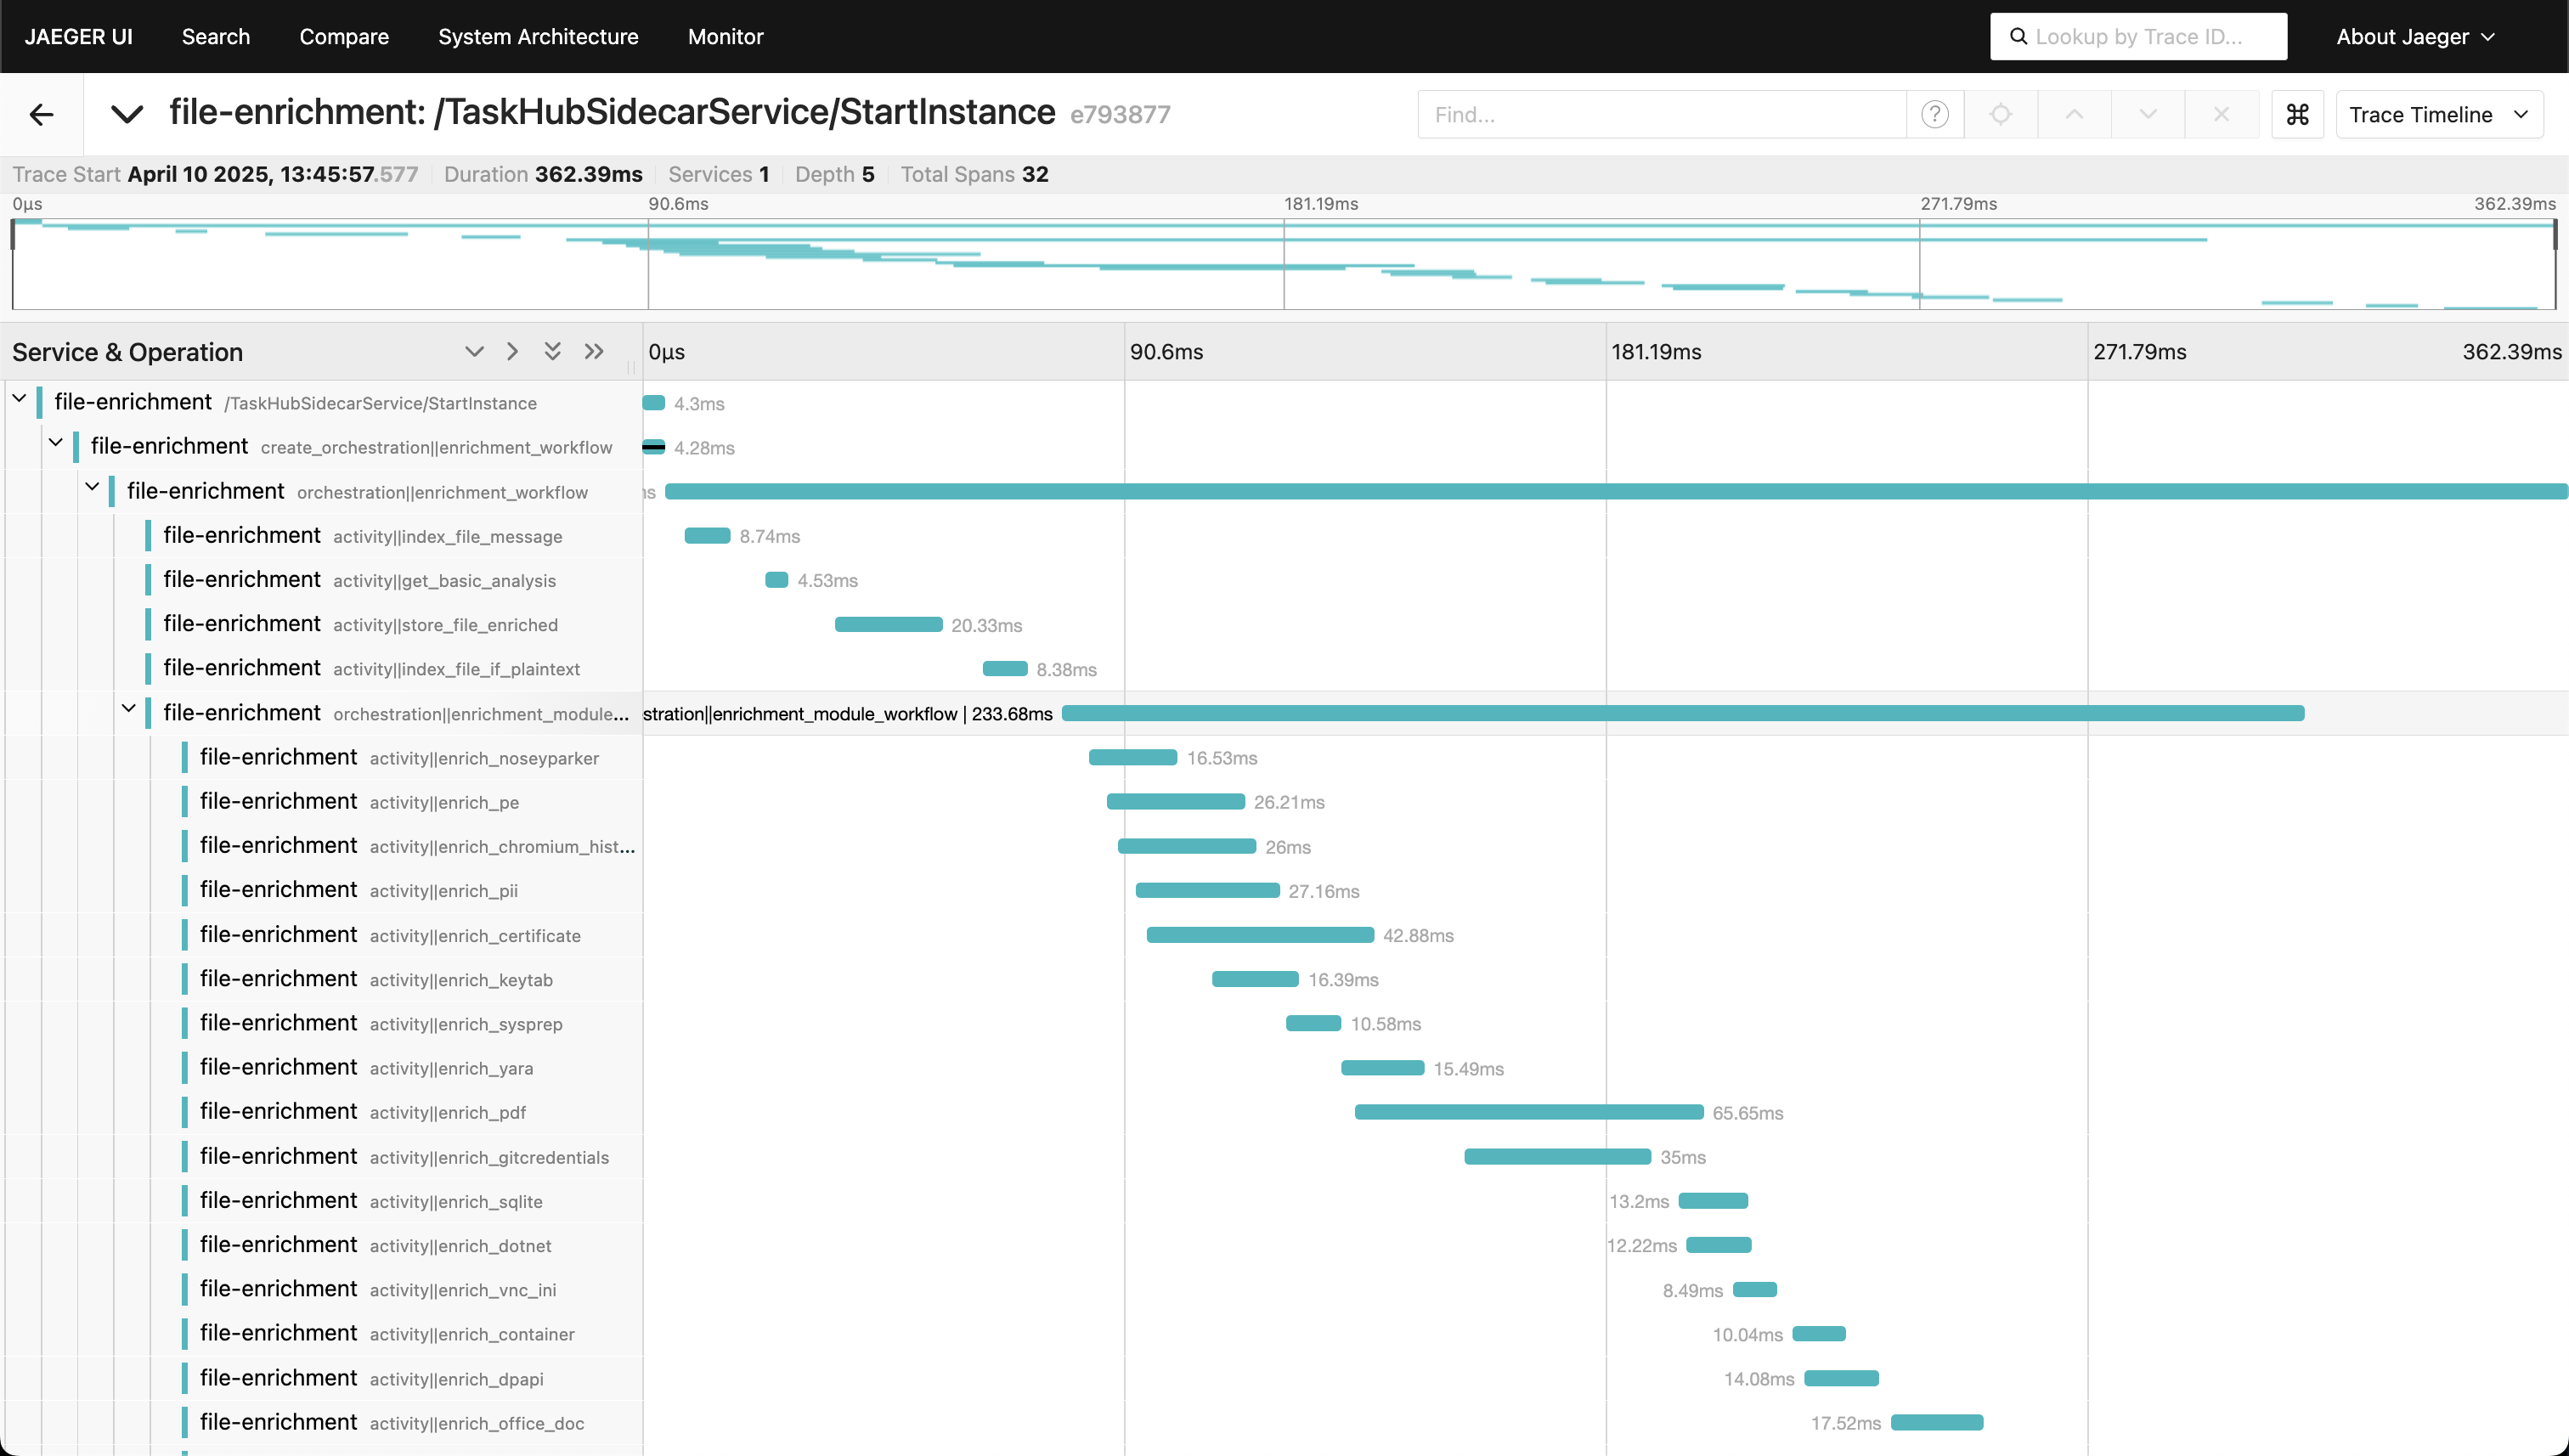 This can help track down locations for slowdown or other failures- for example by filtering across services for `error=true`:
 ## Lazydocker
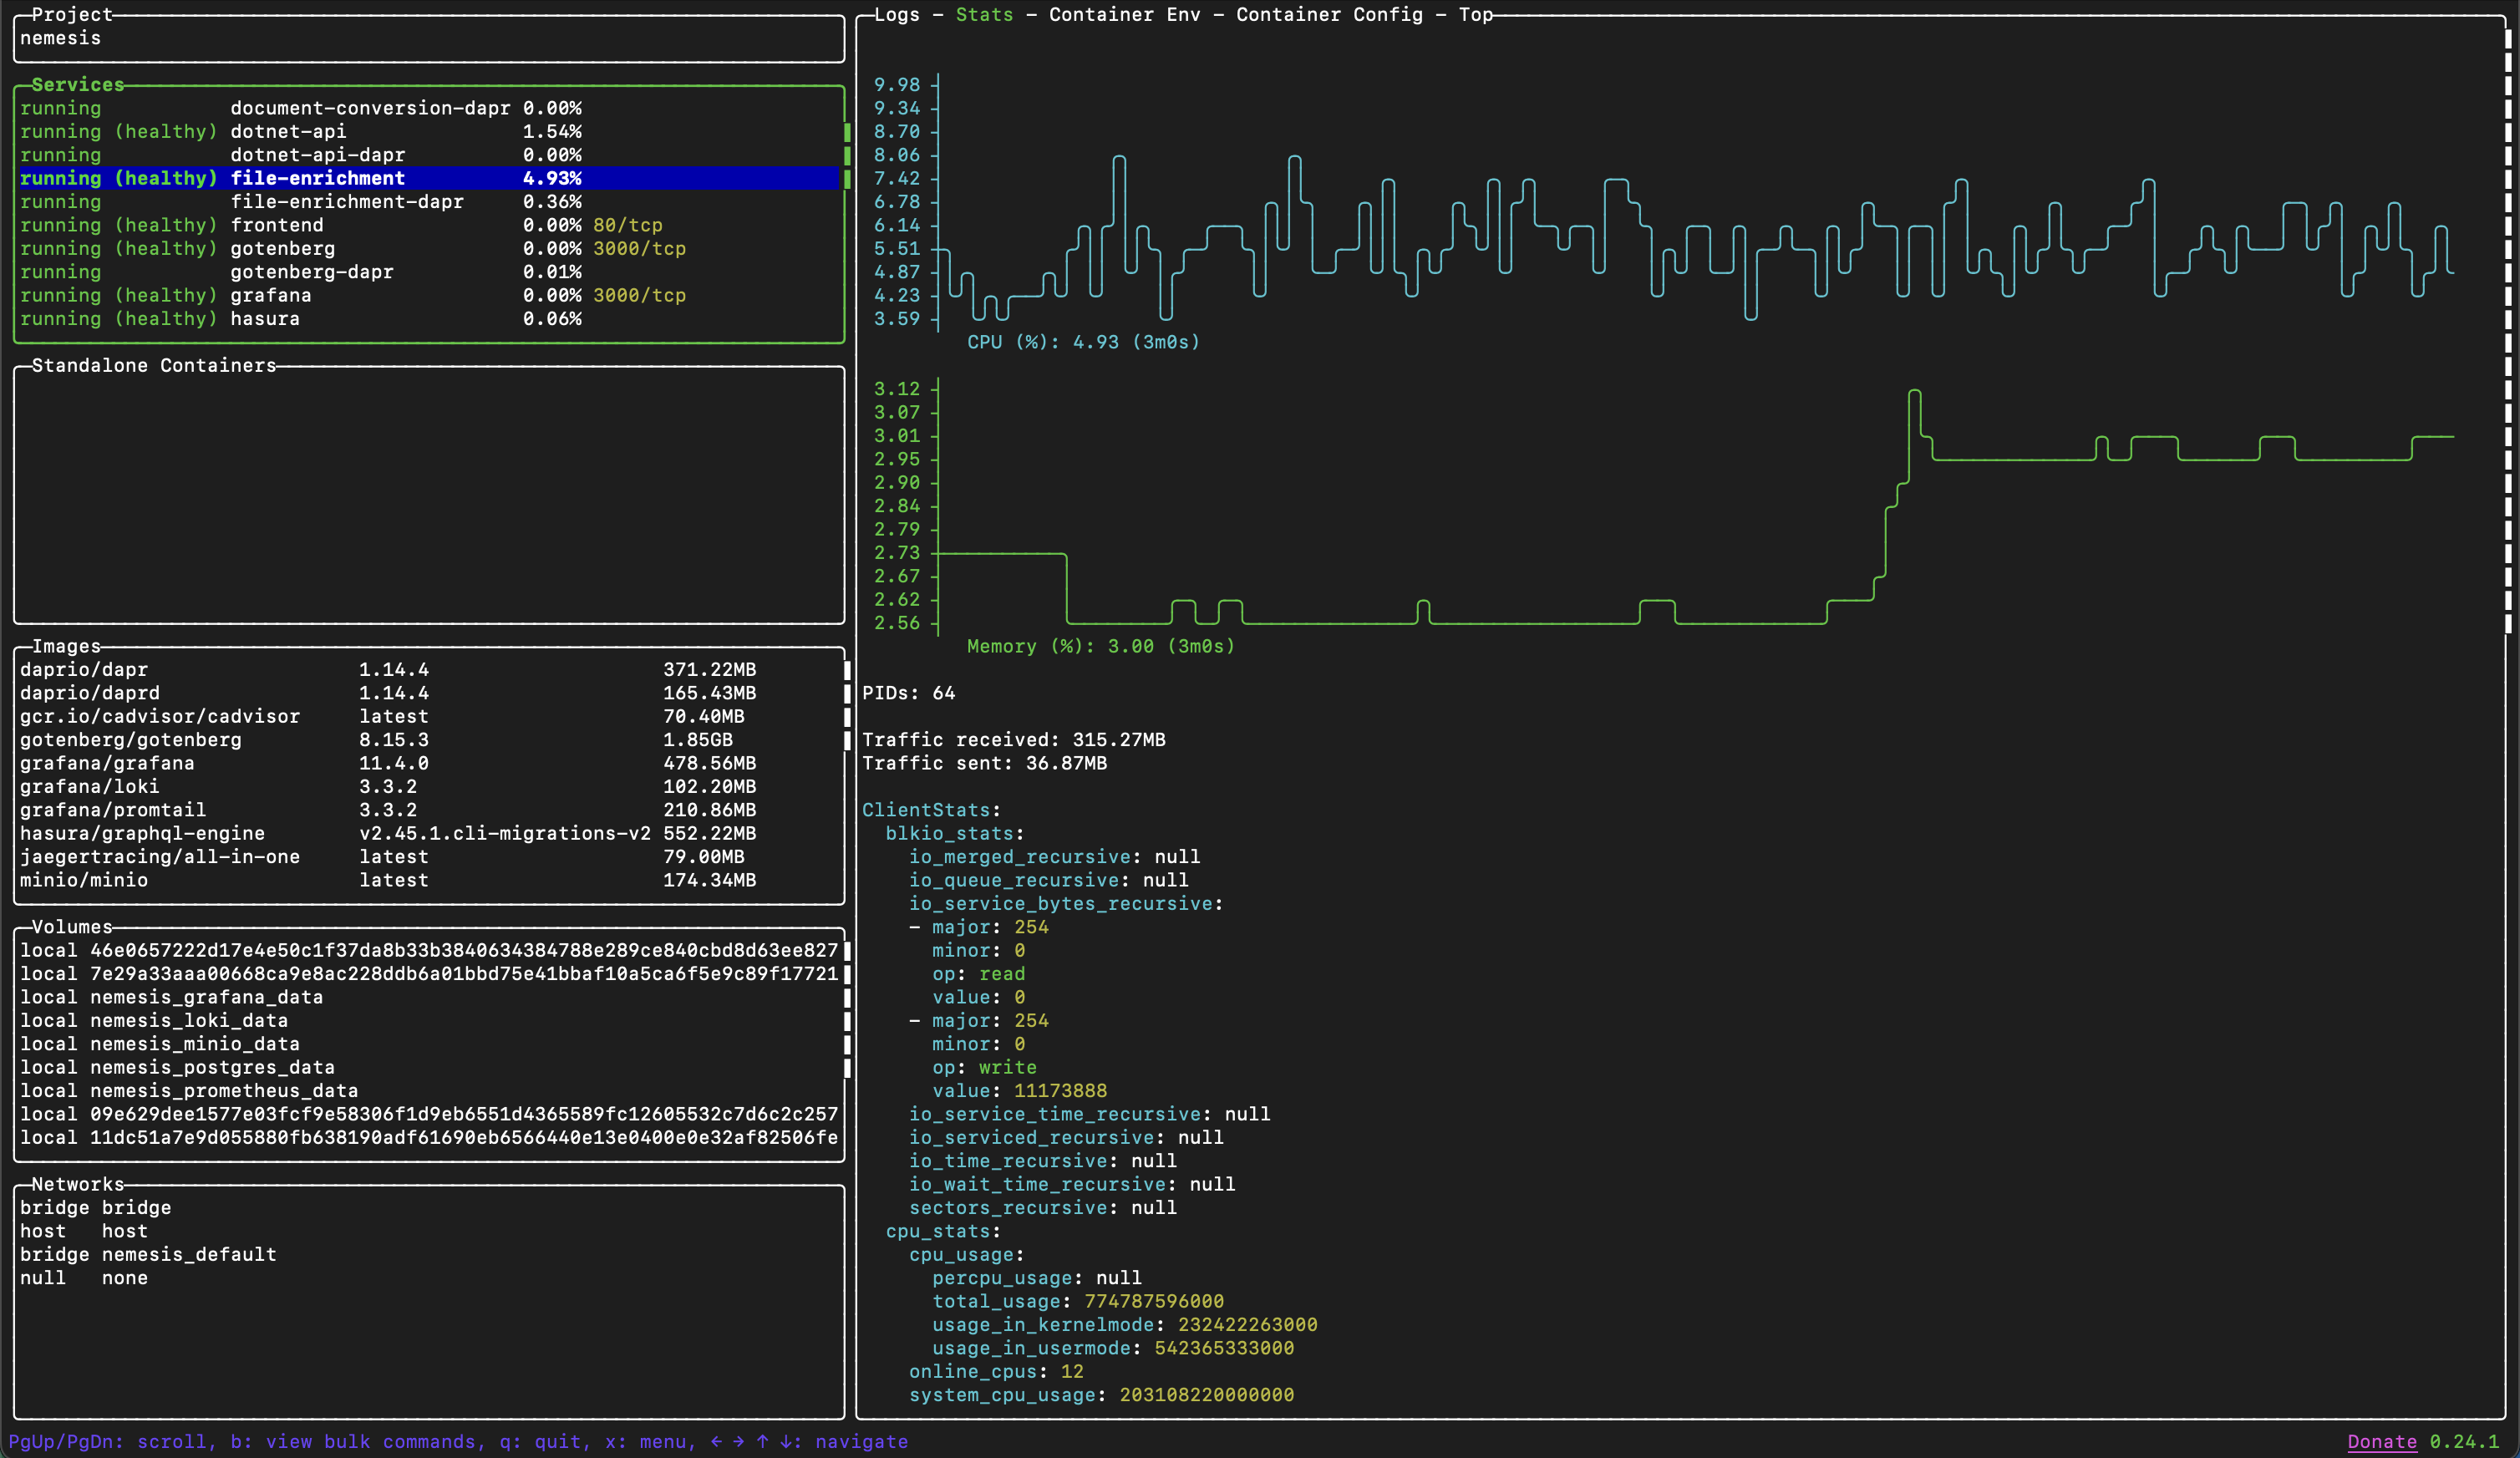
While [Lazydocker](https://github.com/jesseduffield/lazydocker) is not a Nemesis specific project, we highly recommend it for general troubleshooting when using Docker containers:
## Lazydocker
While [Lazydocker](https://github.com/jesseduffield/lazydocker) is not a Nemesis specific project, we highly recommend it for general troubleshooting when using Docker containers: