--monitoring flag when launching Nemesis!
Grafana
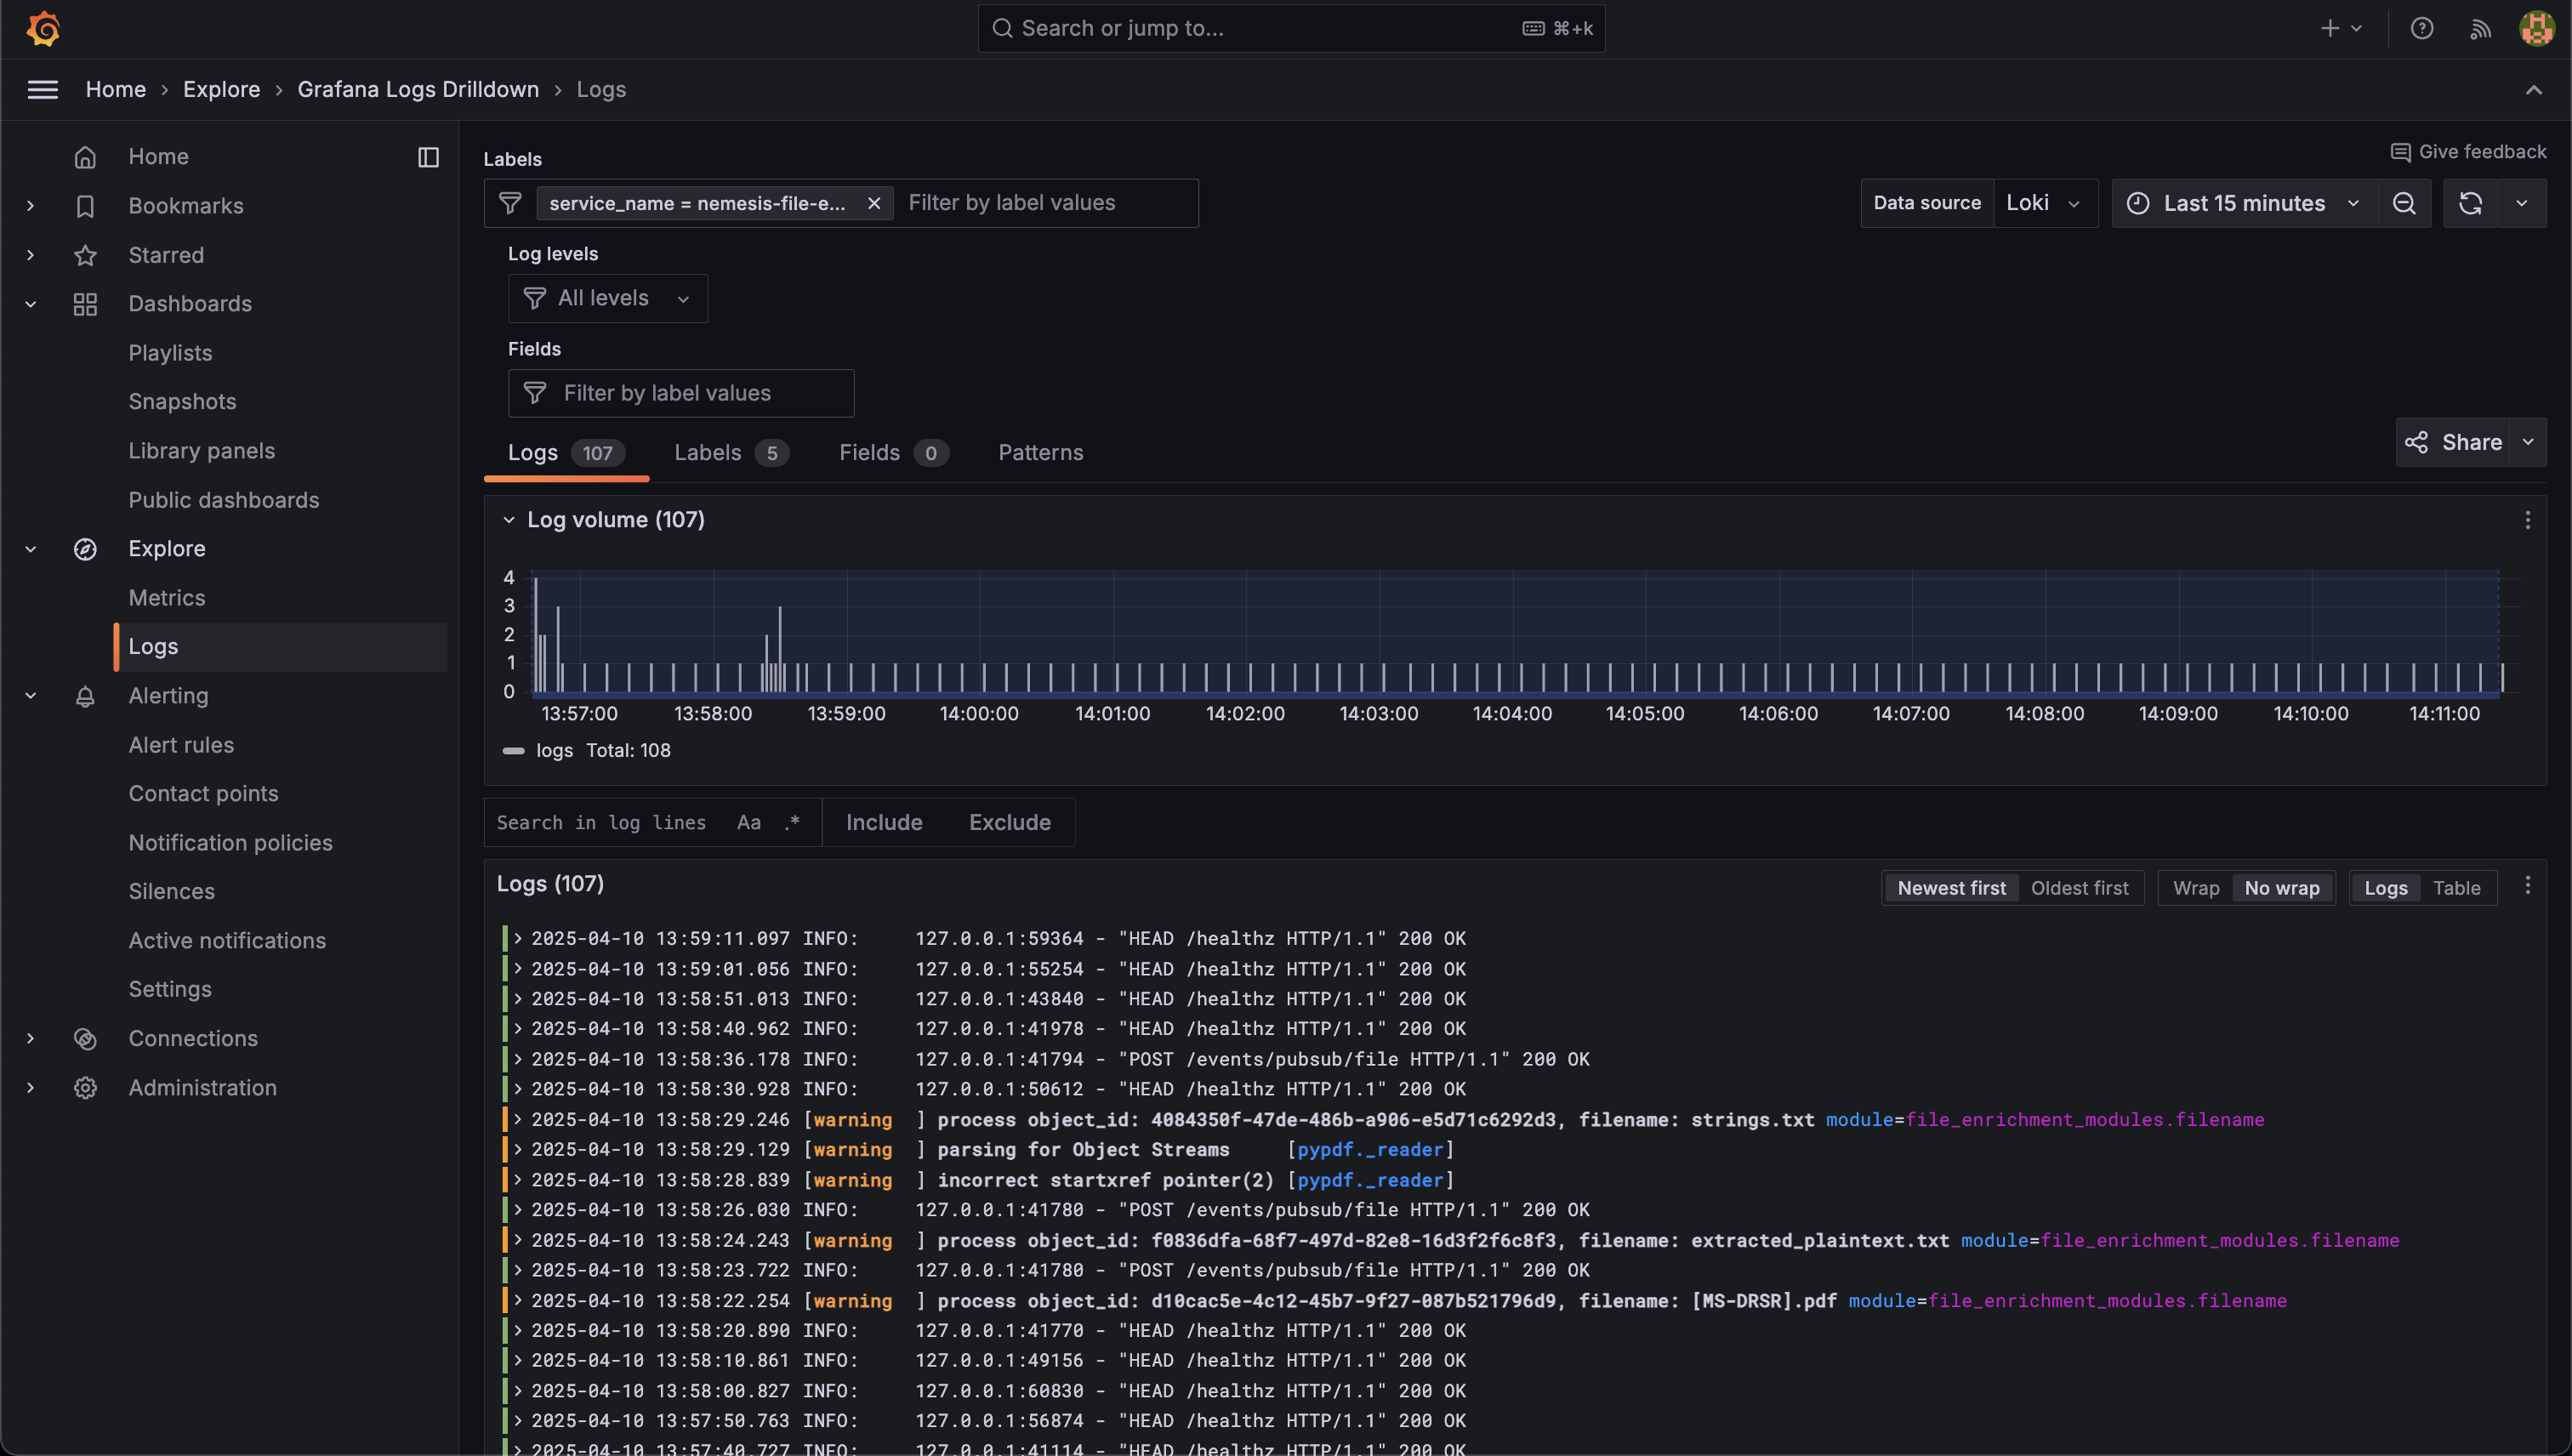
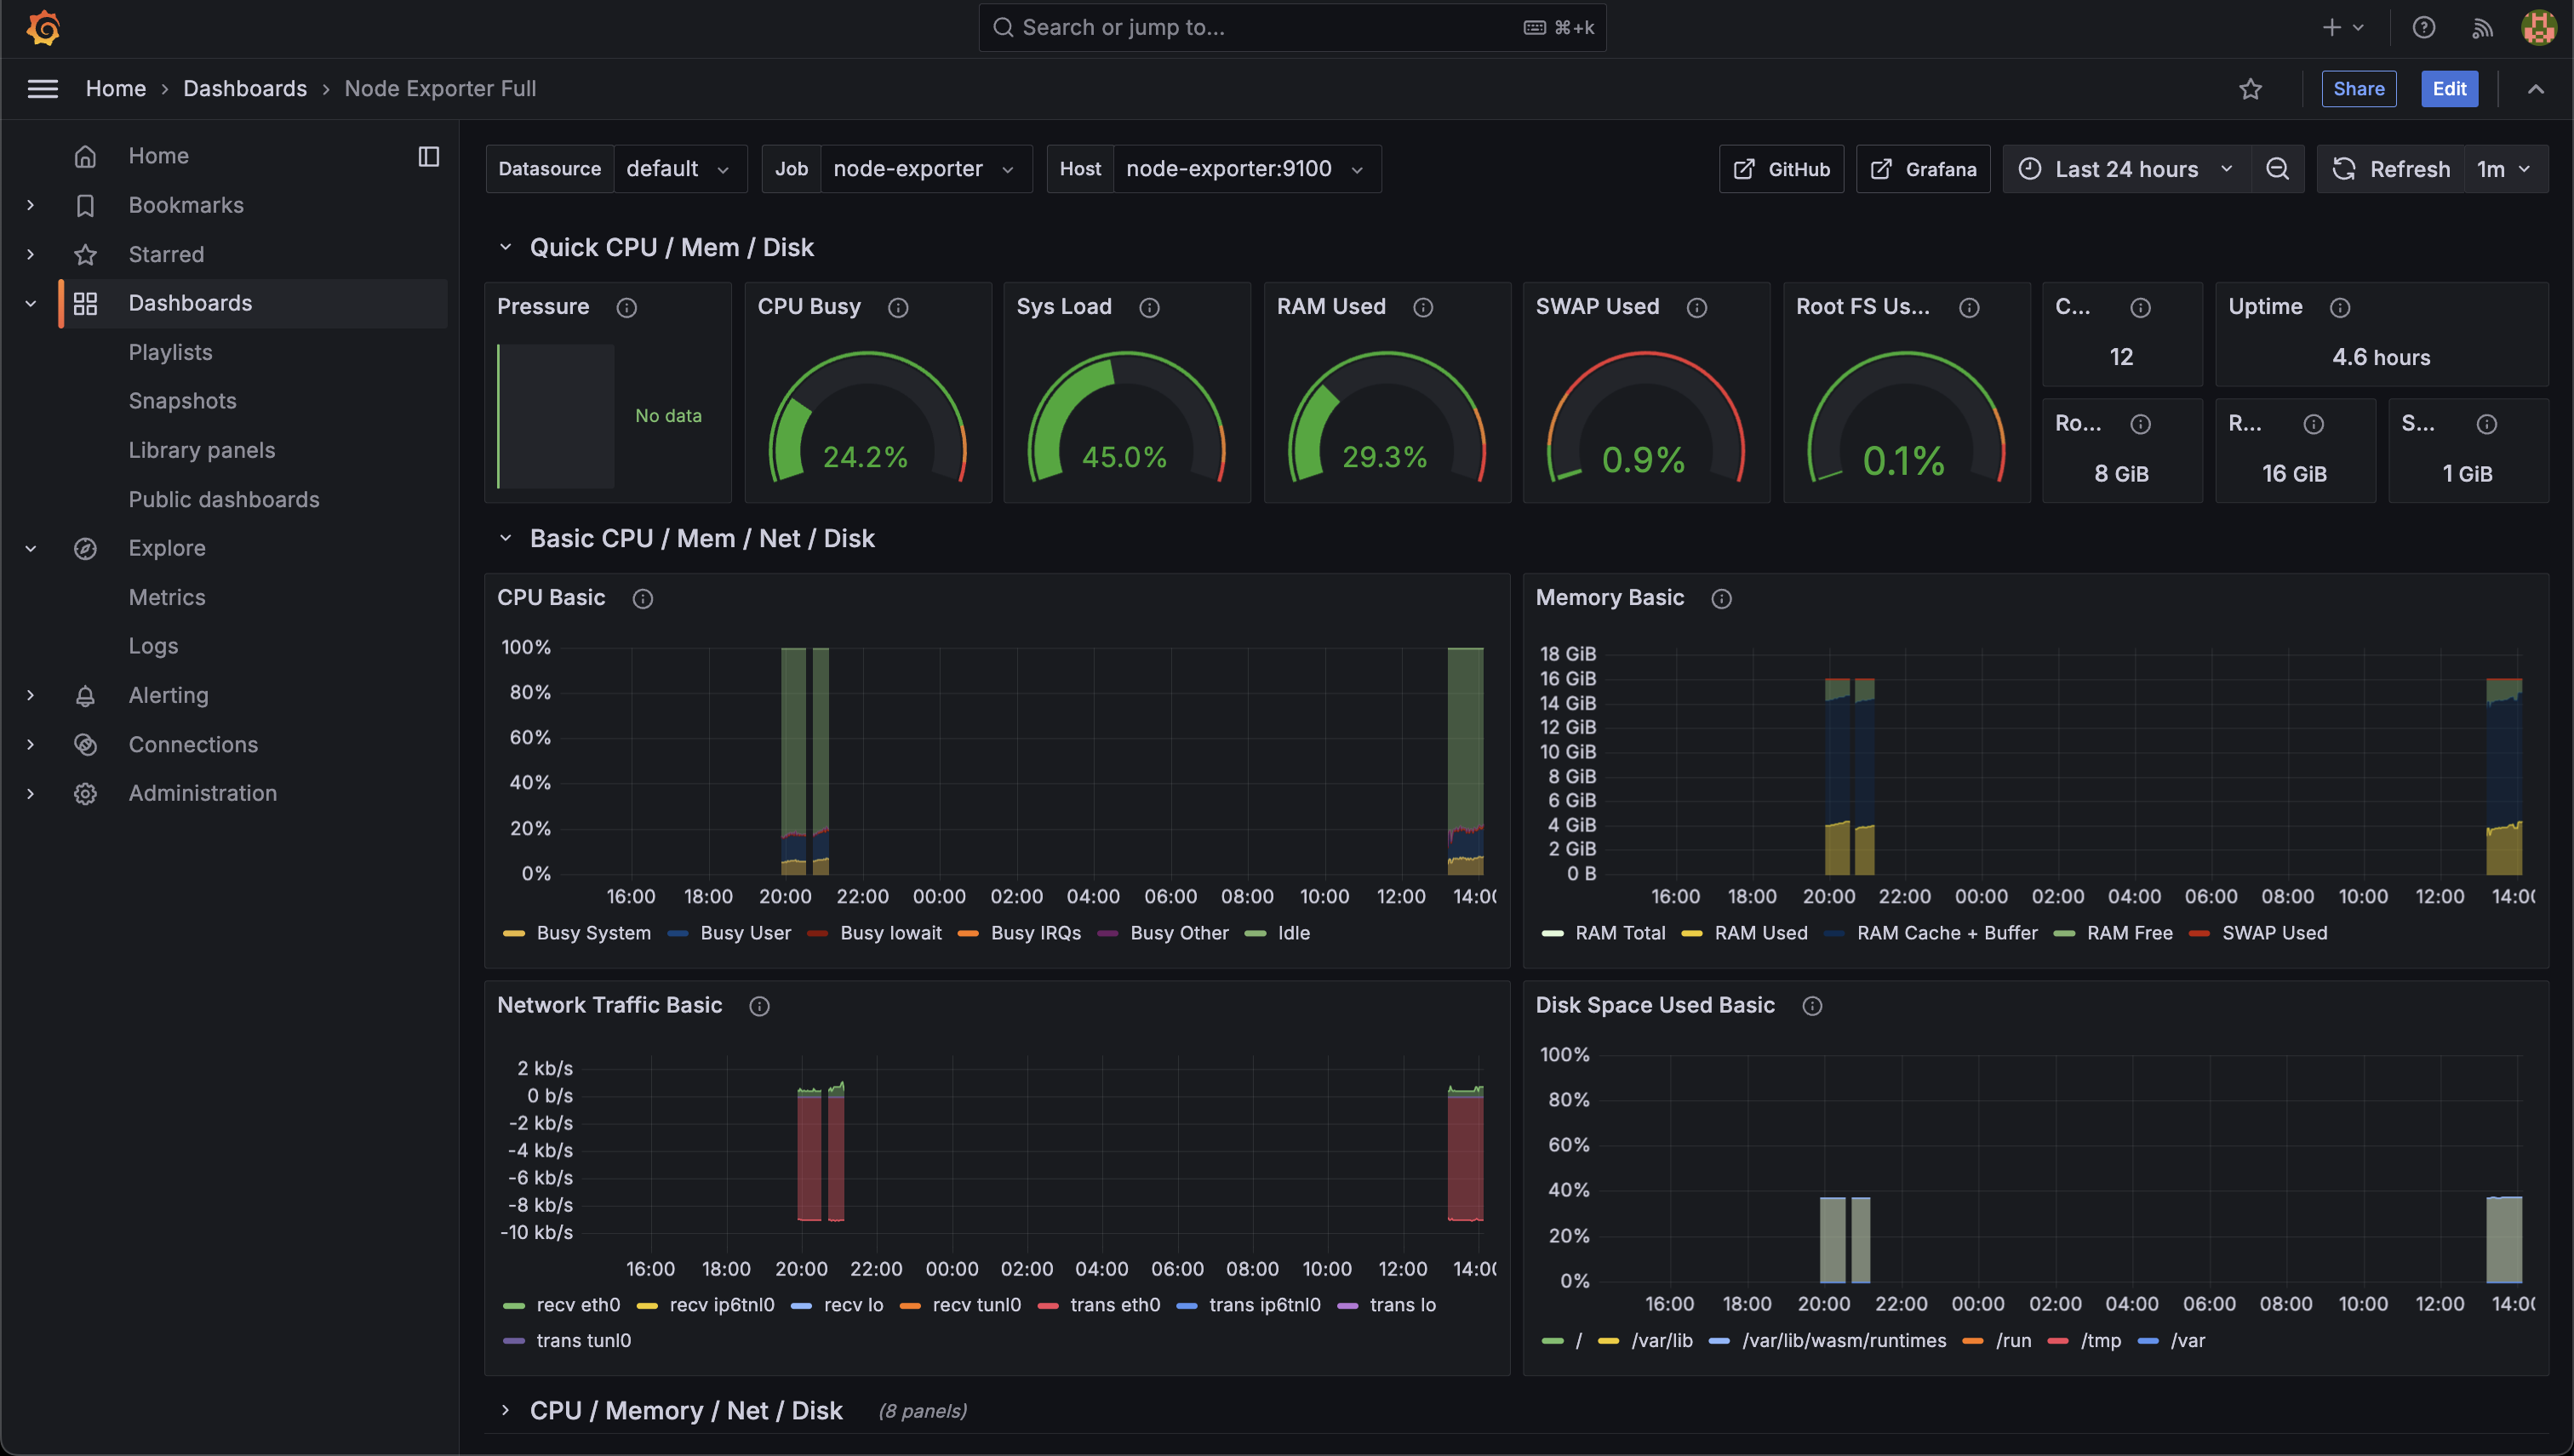
Navigating to the Help menu reachable in the bottom left of the Nemesis interface and clicking the/grafana/ route link will take you to the Grafana interface. Clicking the Metrics Grafana link on the Help page will take you to the general metrics visualization:
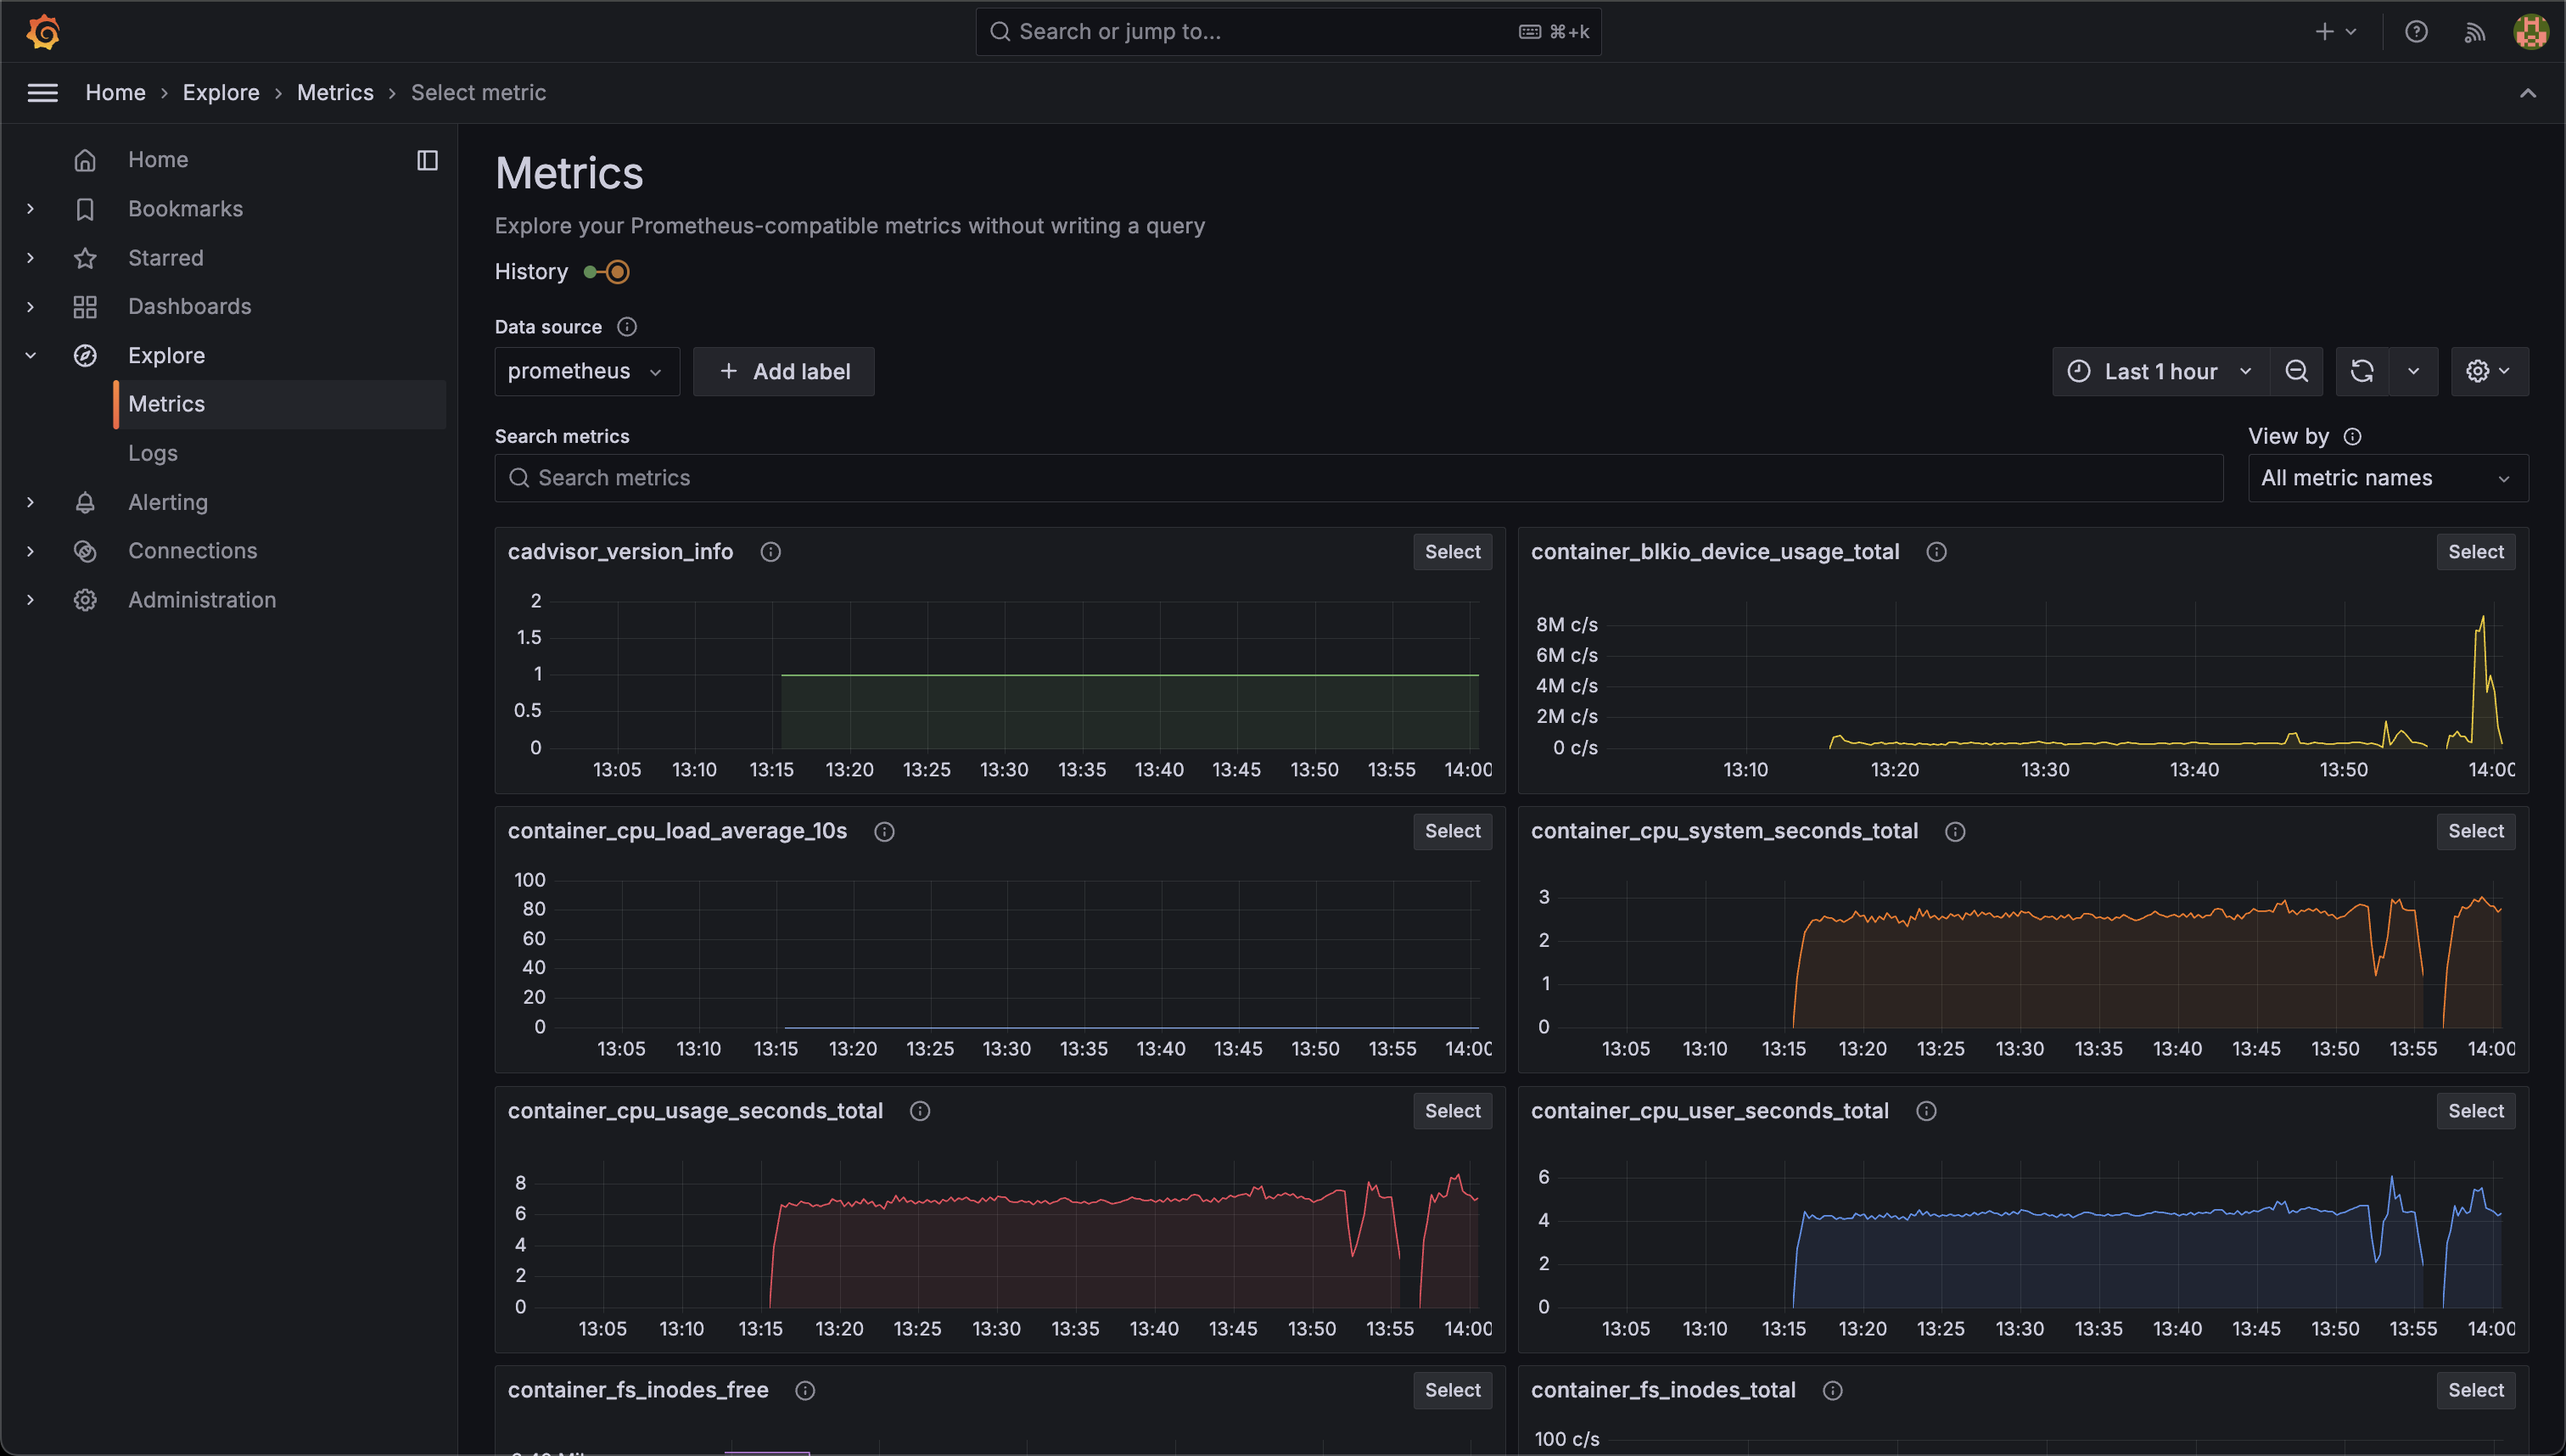
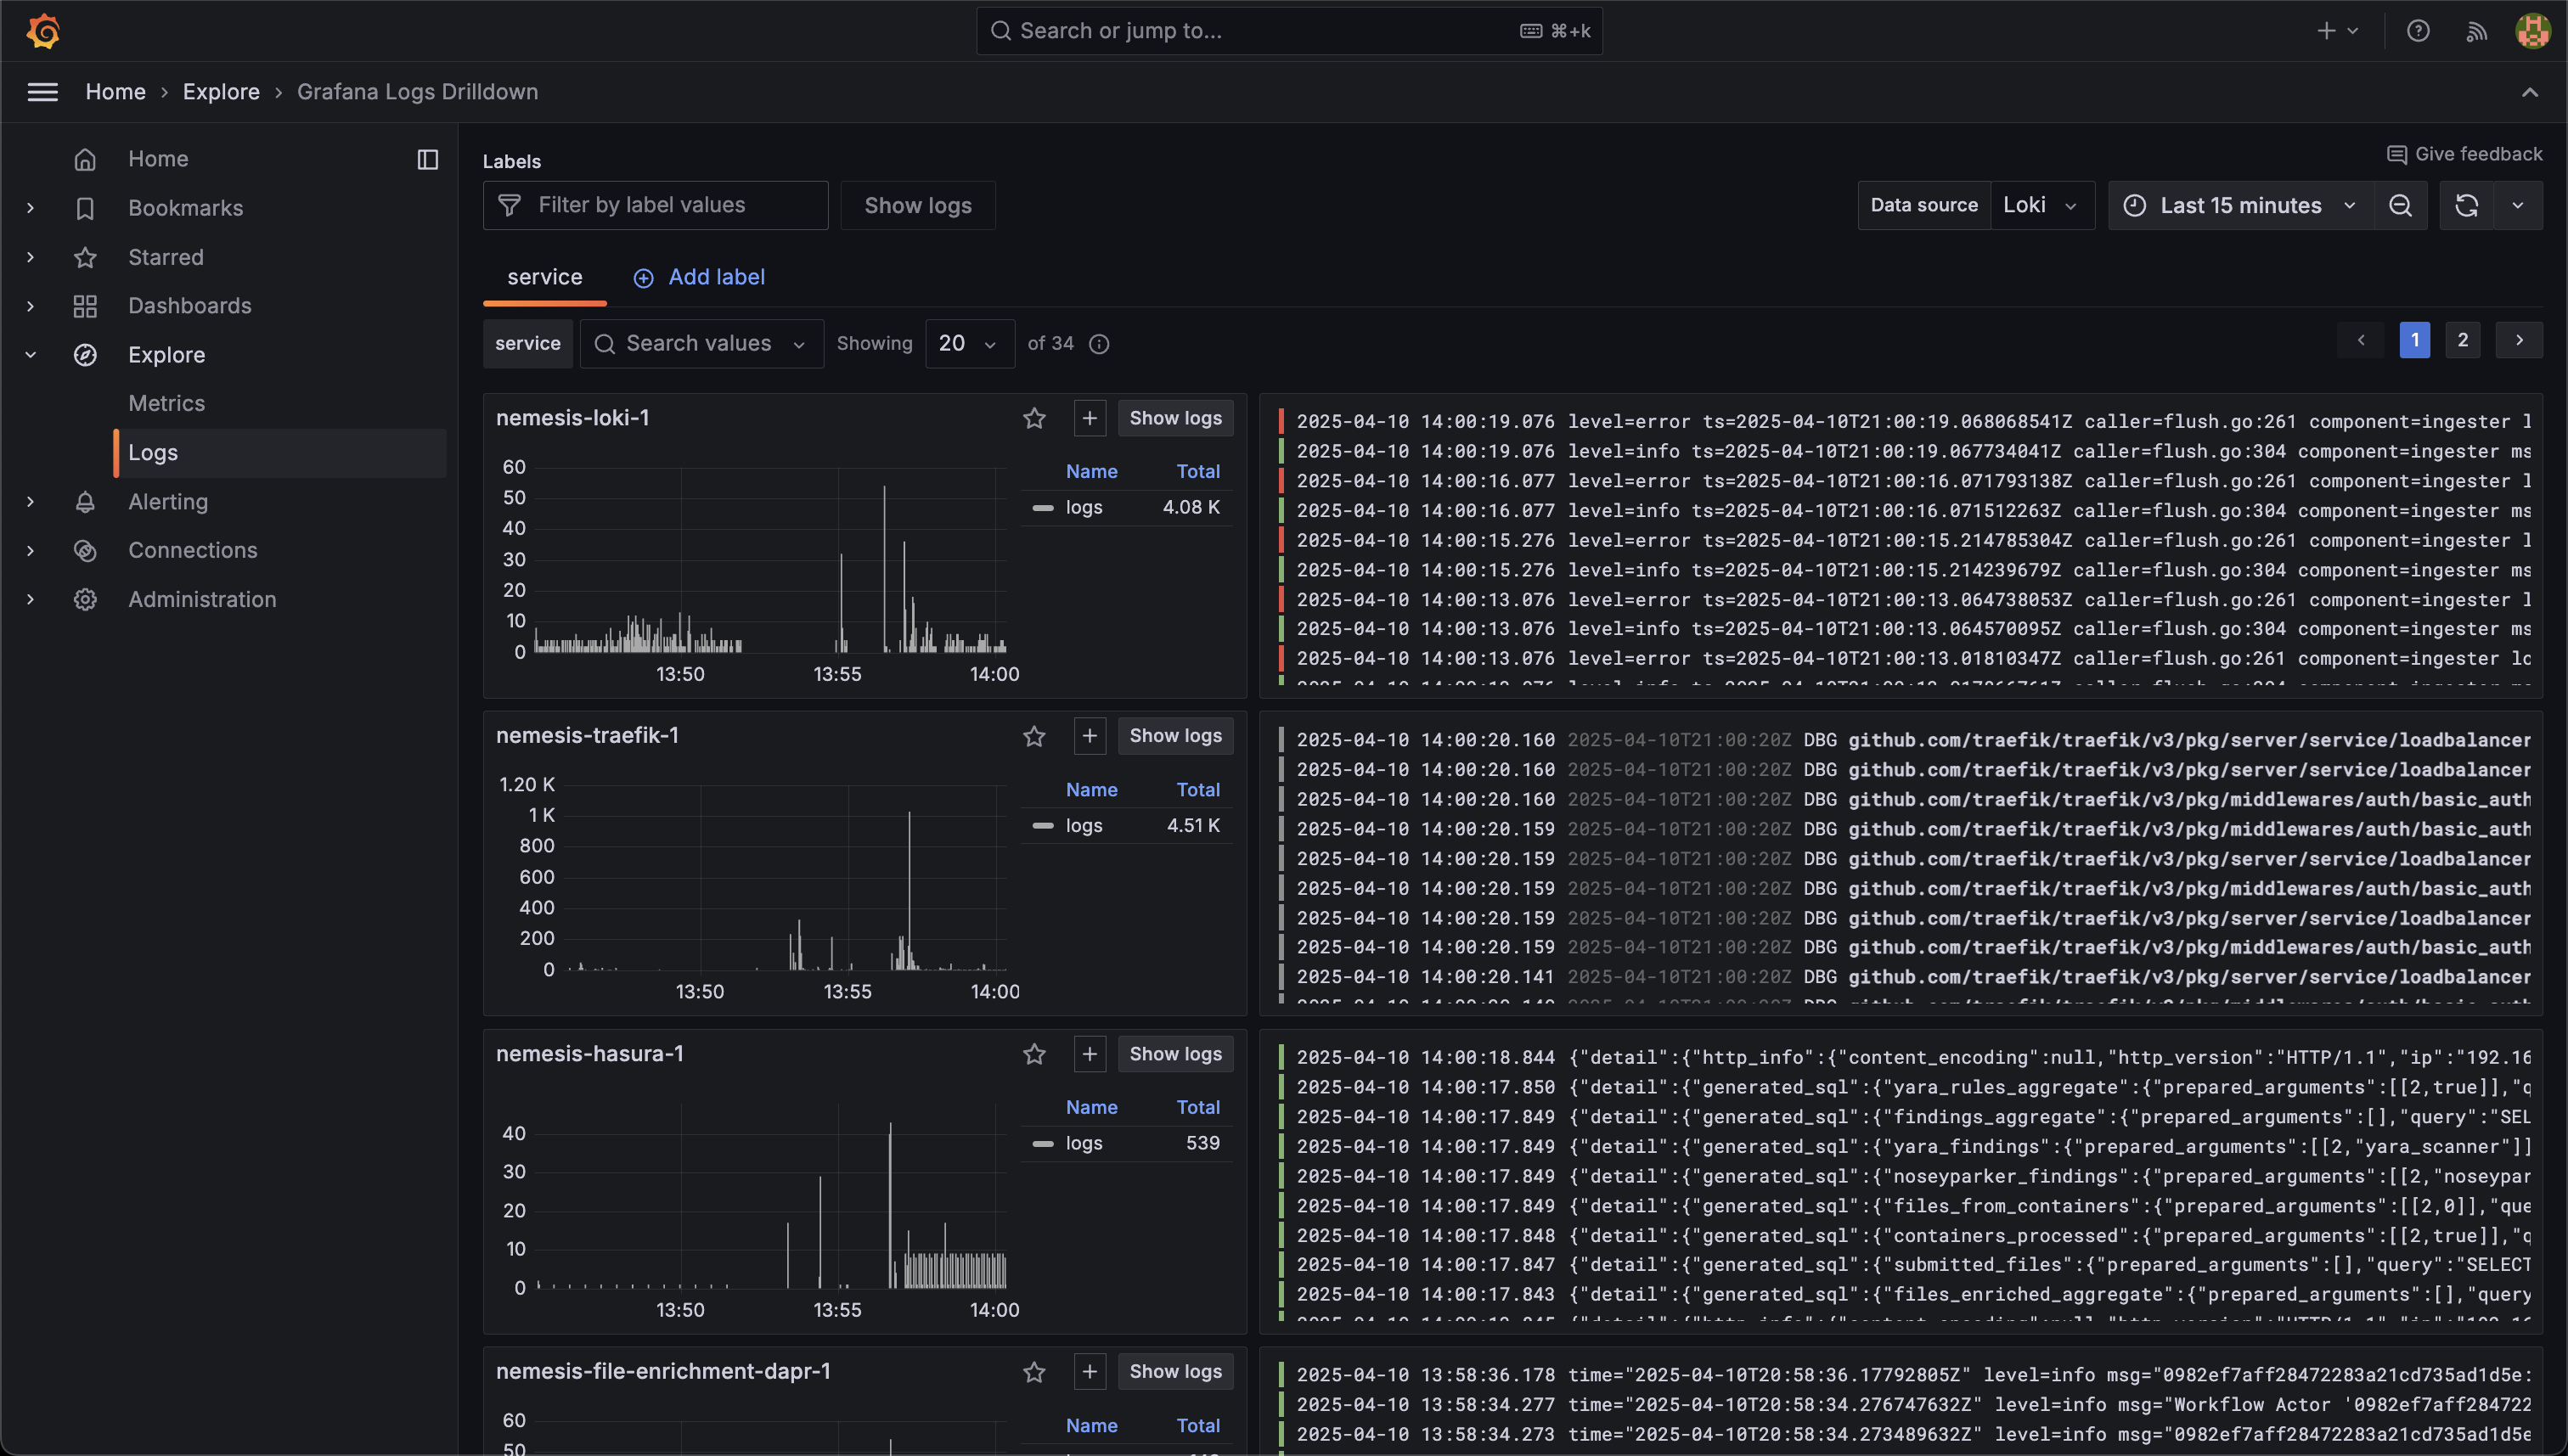
nemesis-file-enrichment service:
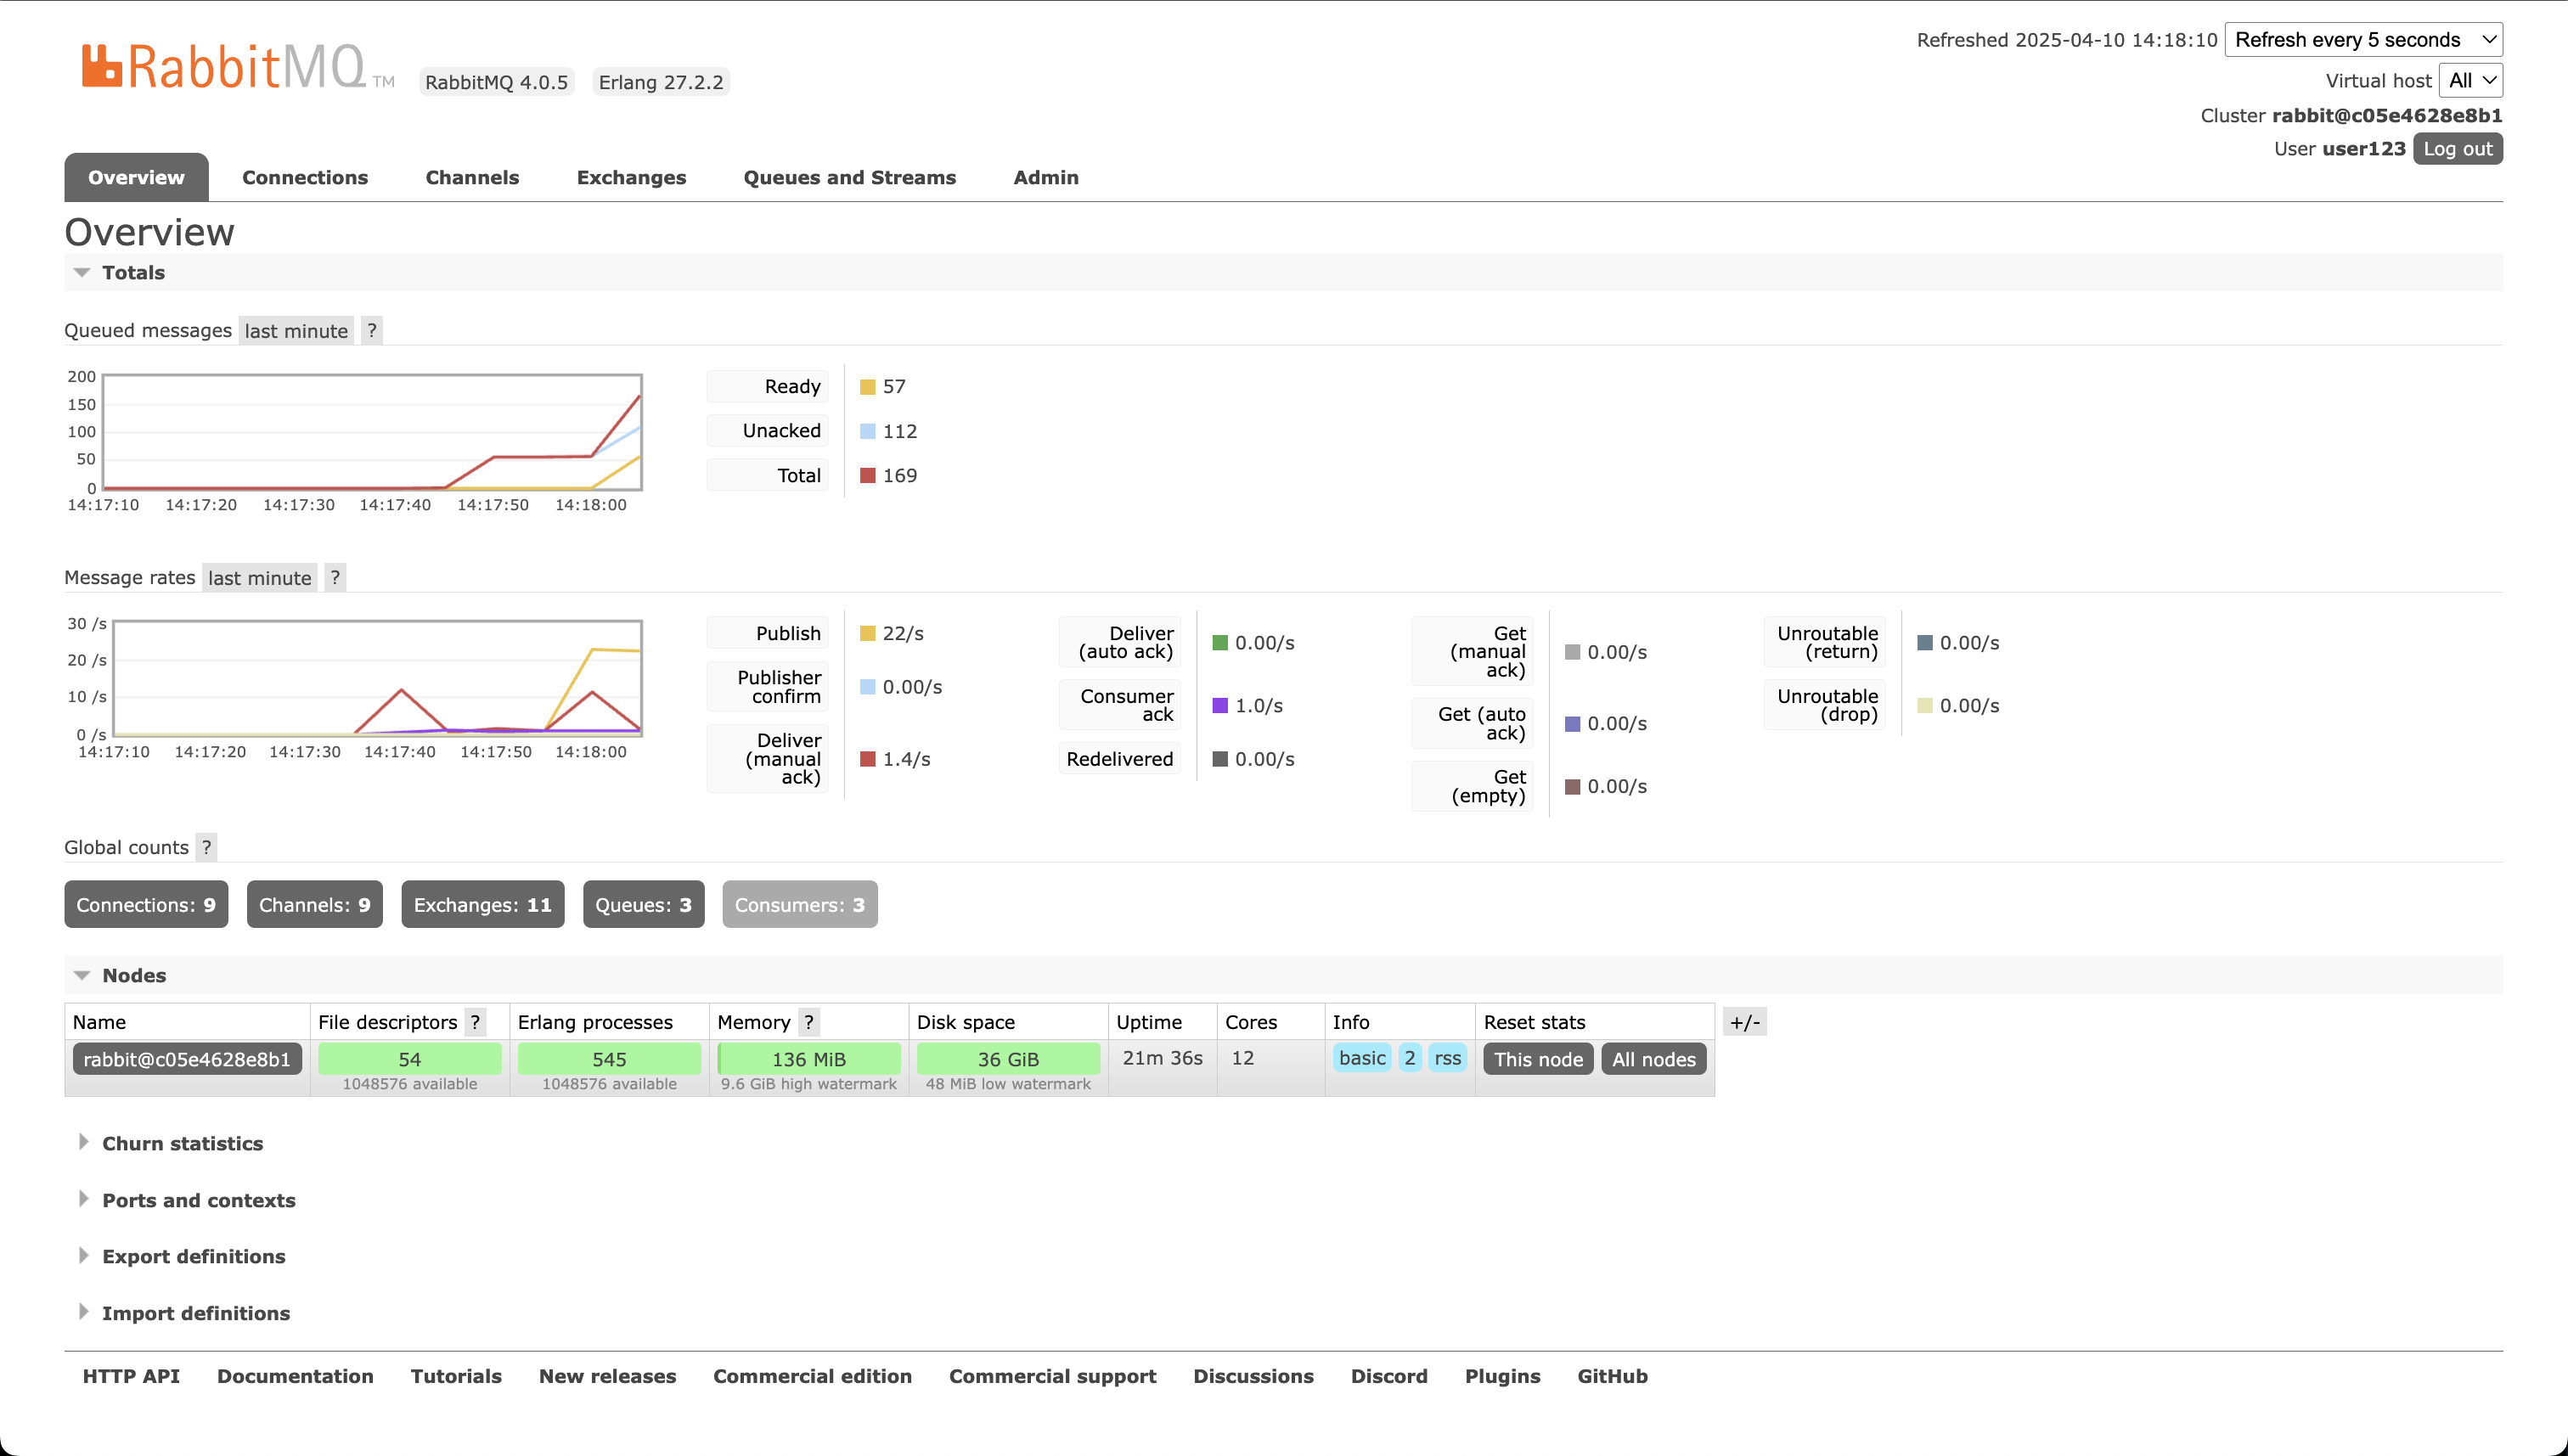
RabbitMQ Dashboard
While the queueing system for Nemesis is swappable with Dapr, Nemesis currently uses RabbitMQ. Navigating to the Help menu reachable in the bottom left of the Nemesis interface and clicking the/rabbitmq/ route link will take you to the RabbitMQ interface. This interface can be used to track message delivery rates/etc.
Jaeger Tracing
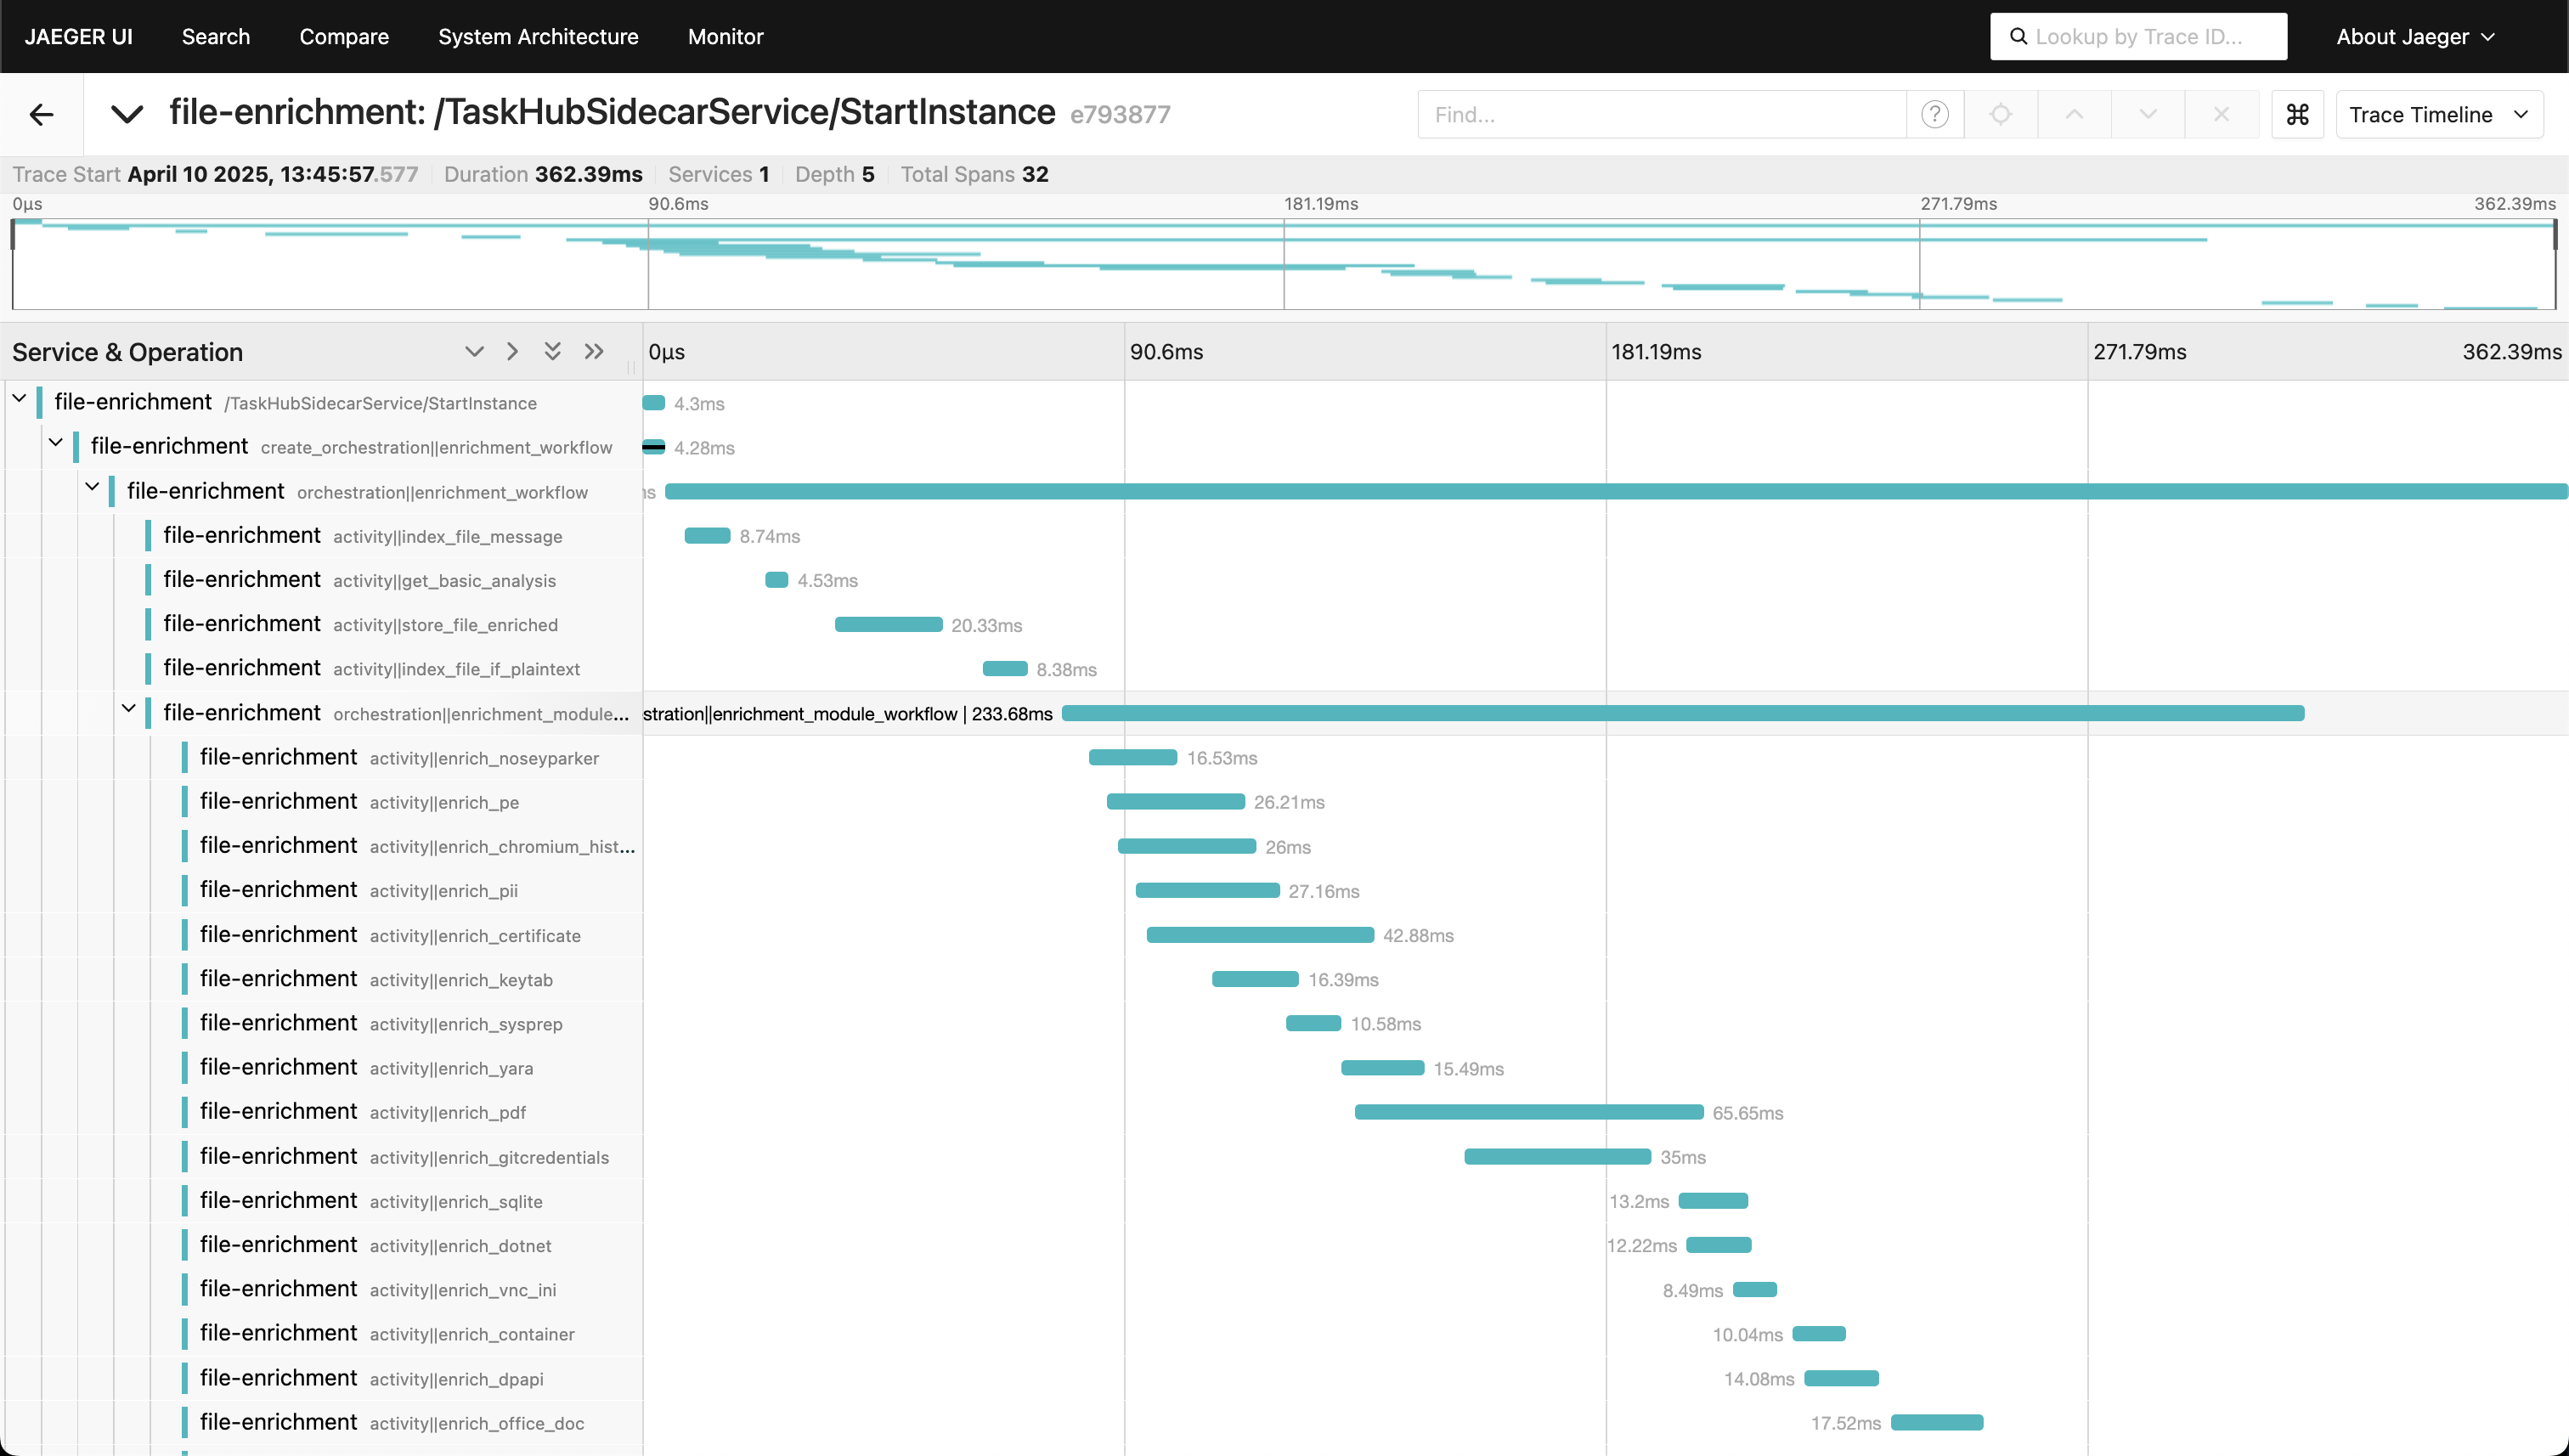
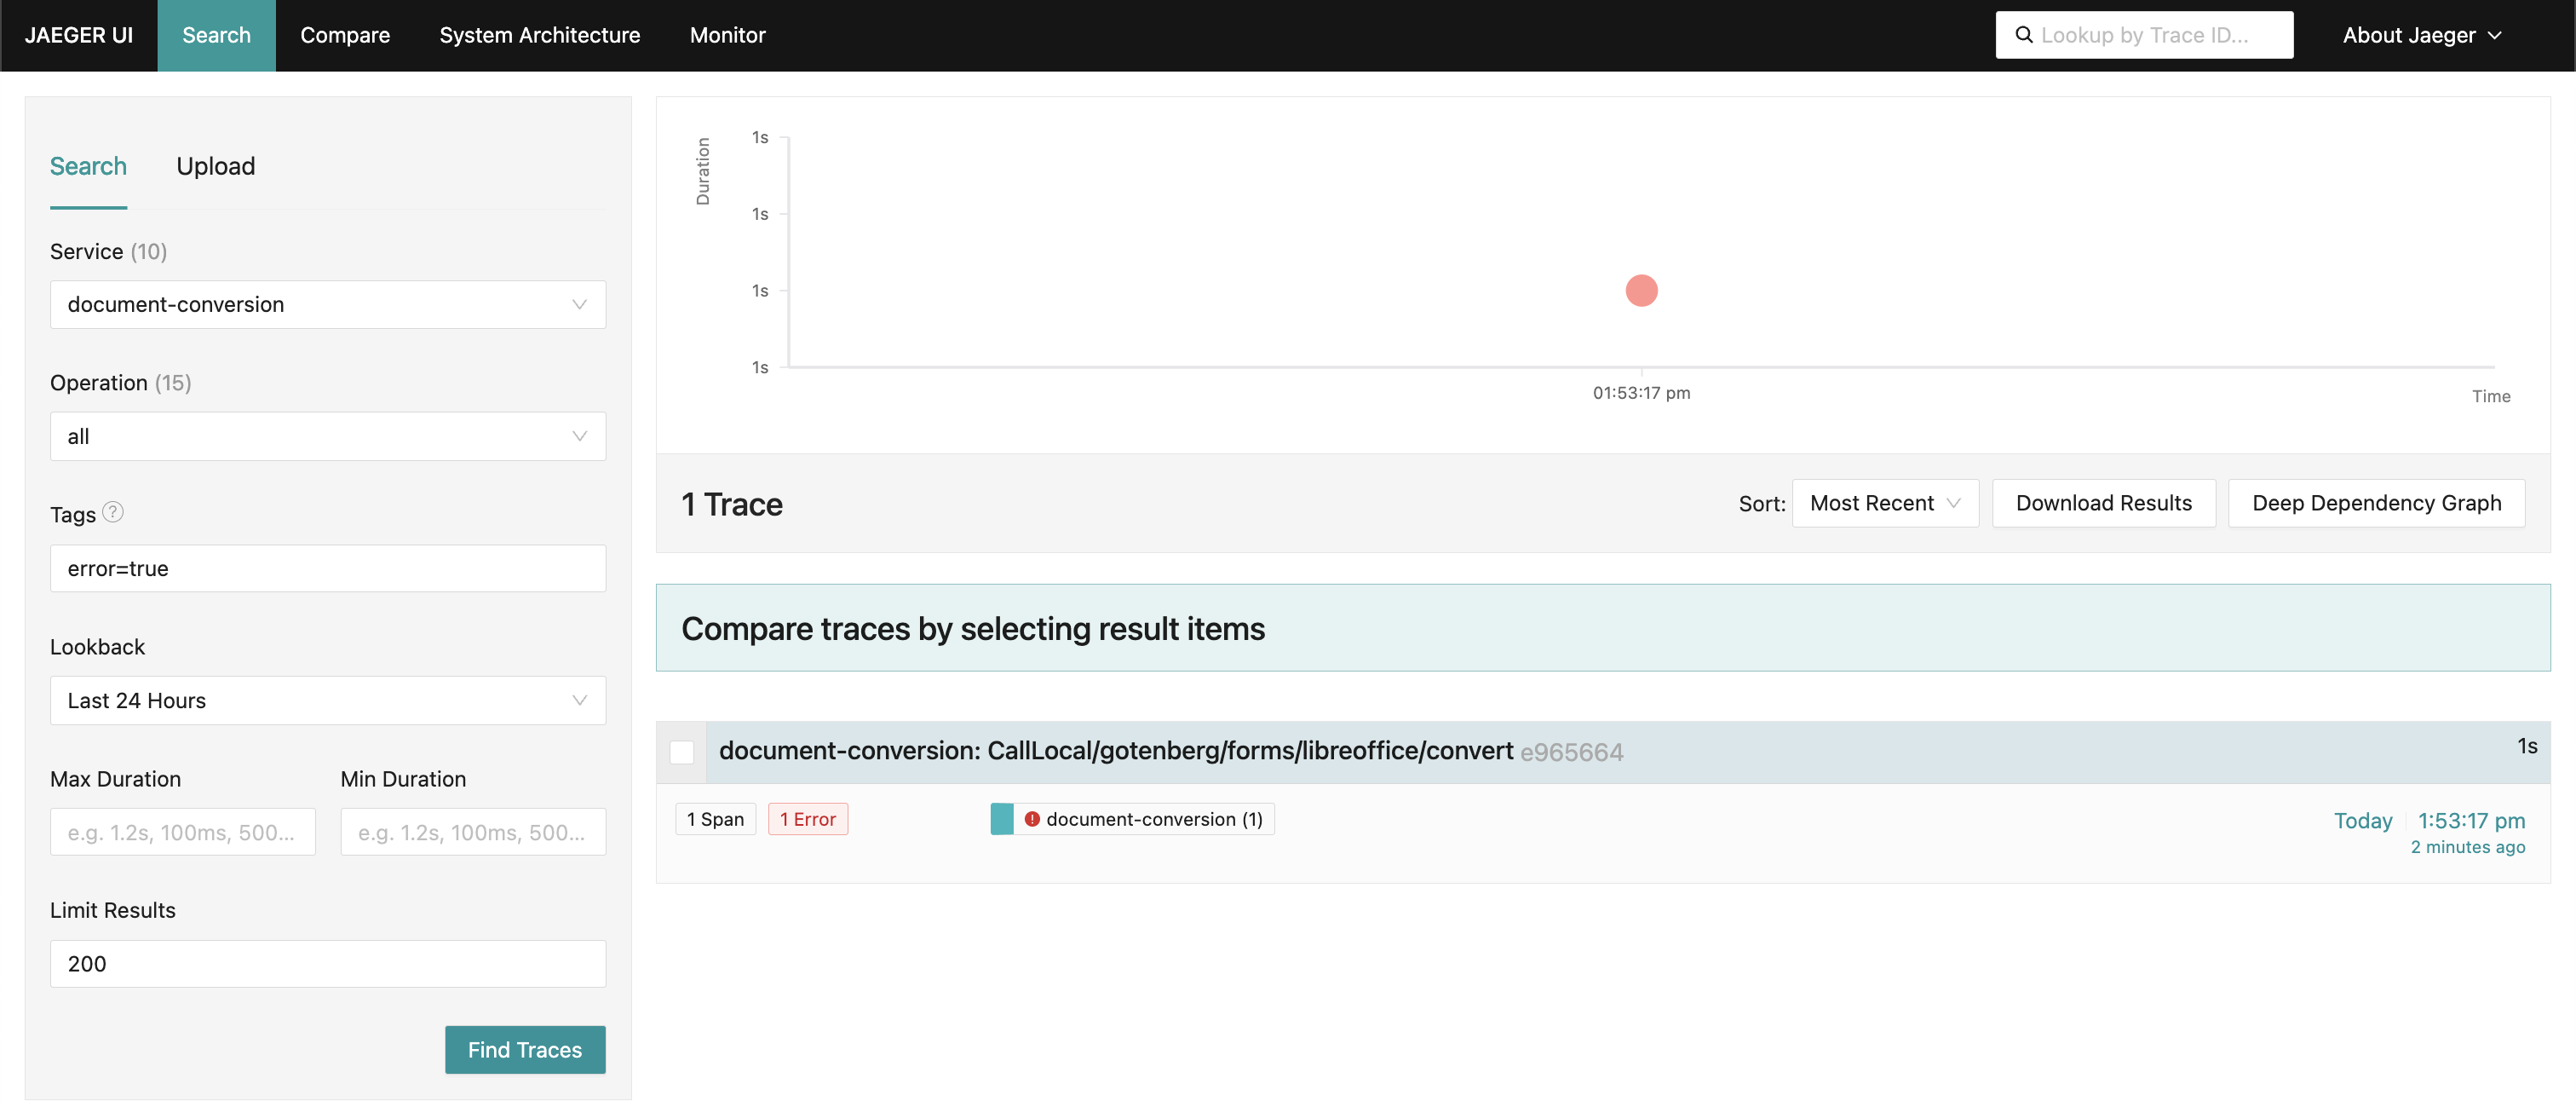
Navigating to the Help menu reachable in the bottom left of the Nemesis interface and clicking the/jaeger/ route link will take you to the Jaeger tracing interface. Reaching Jaeger via this link will filter for the file-enrichment: /TaskHubSidecarService/StartInstance trace type by default (the Dapr file_enrichment workflow trace):
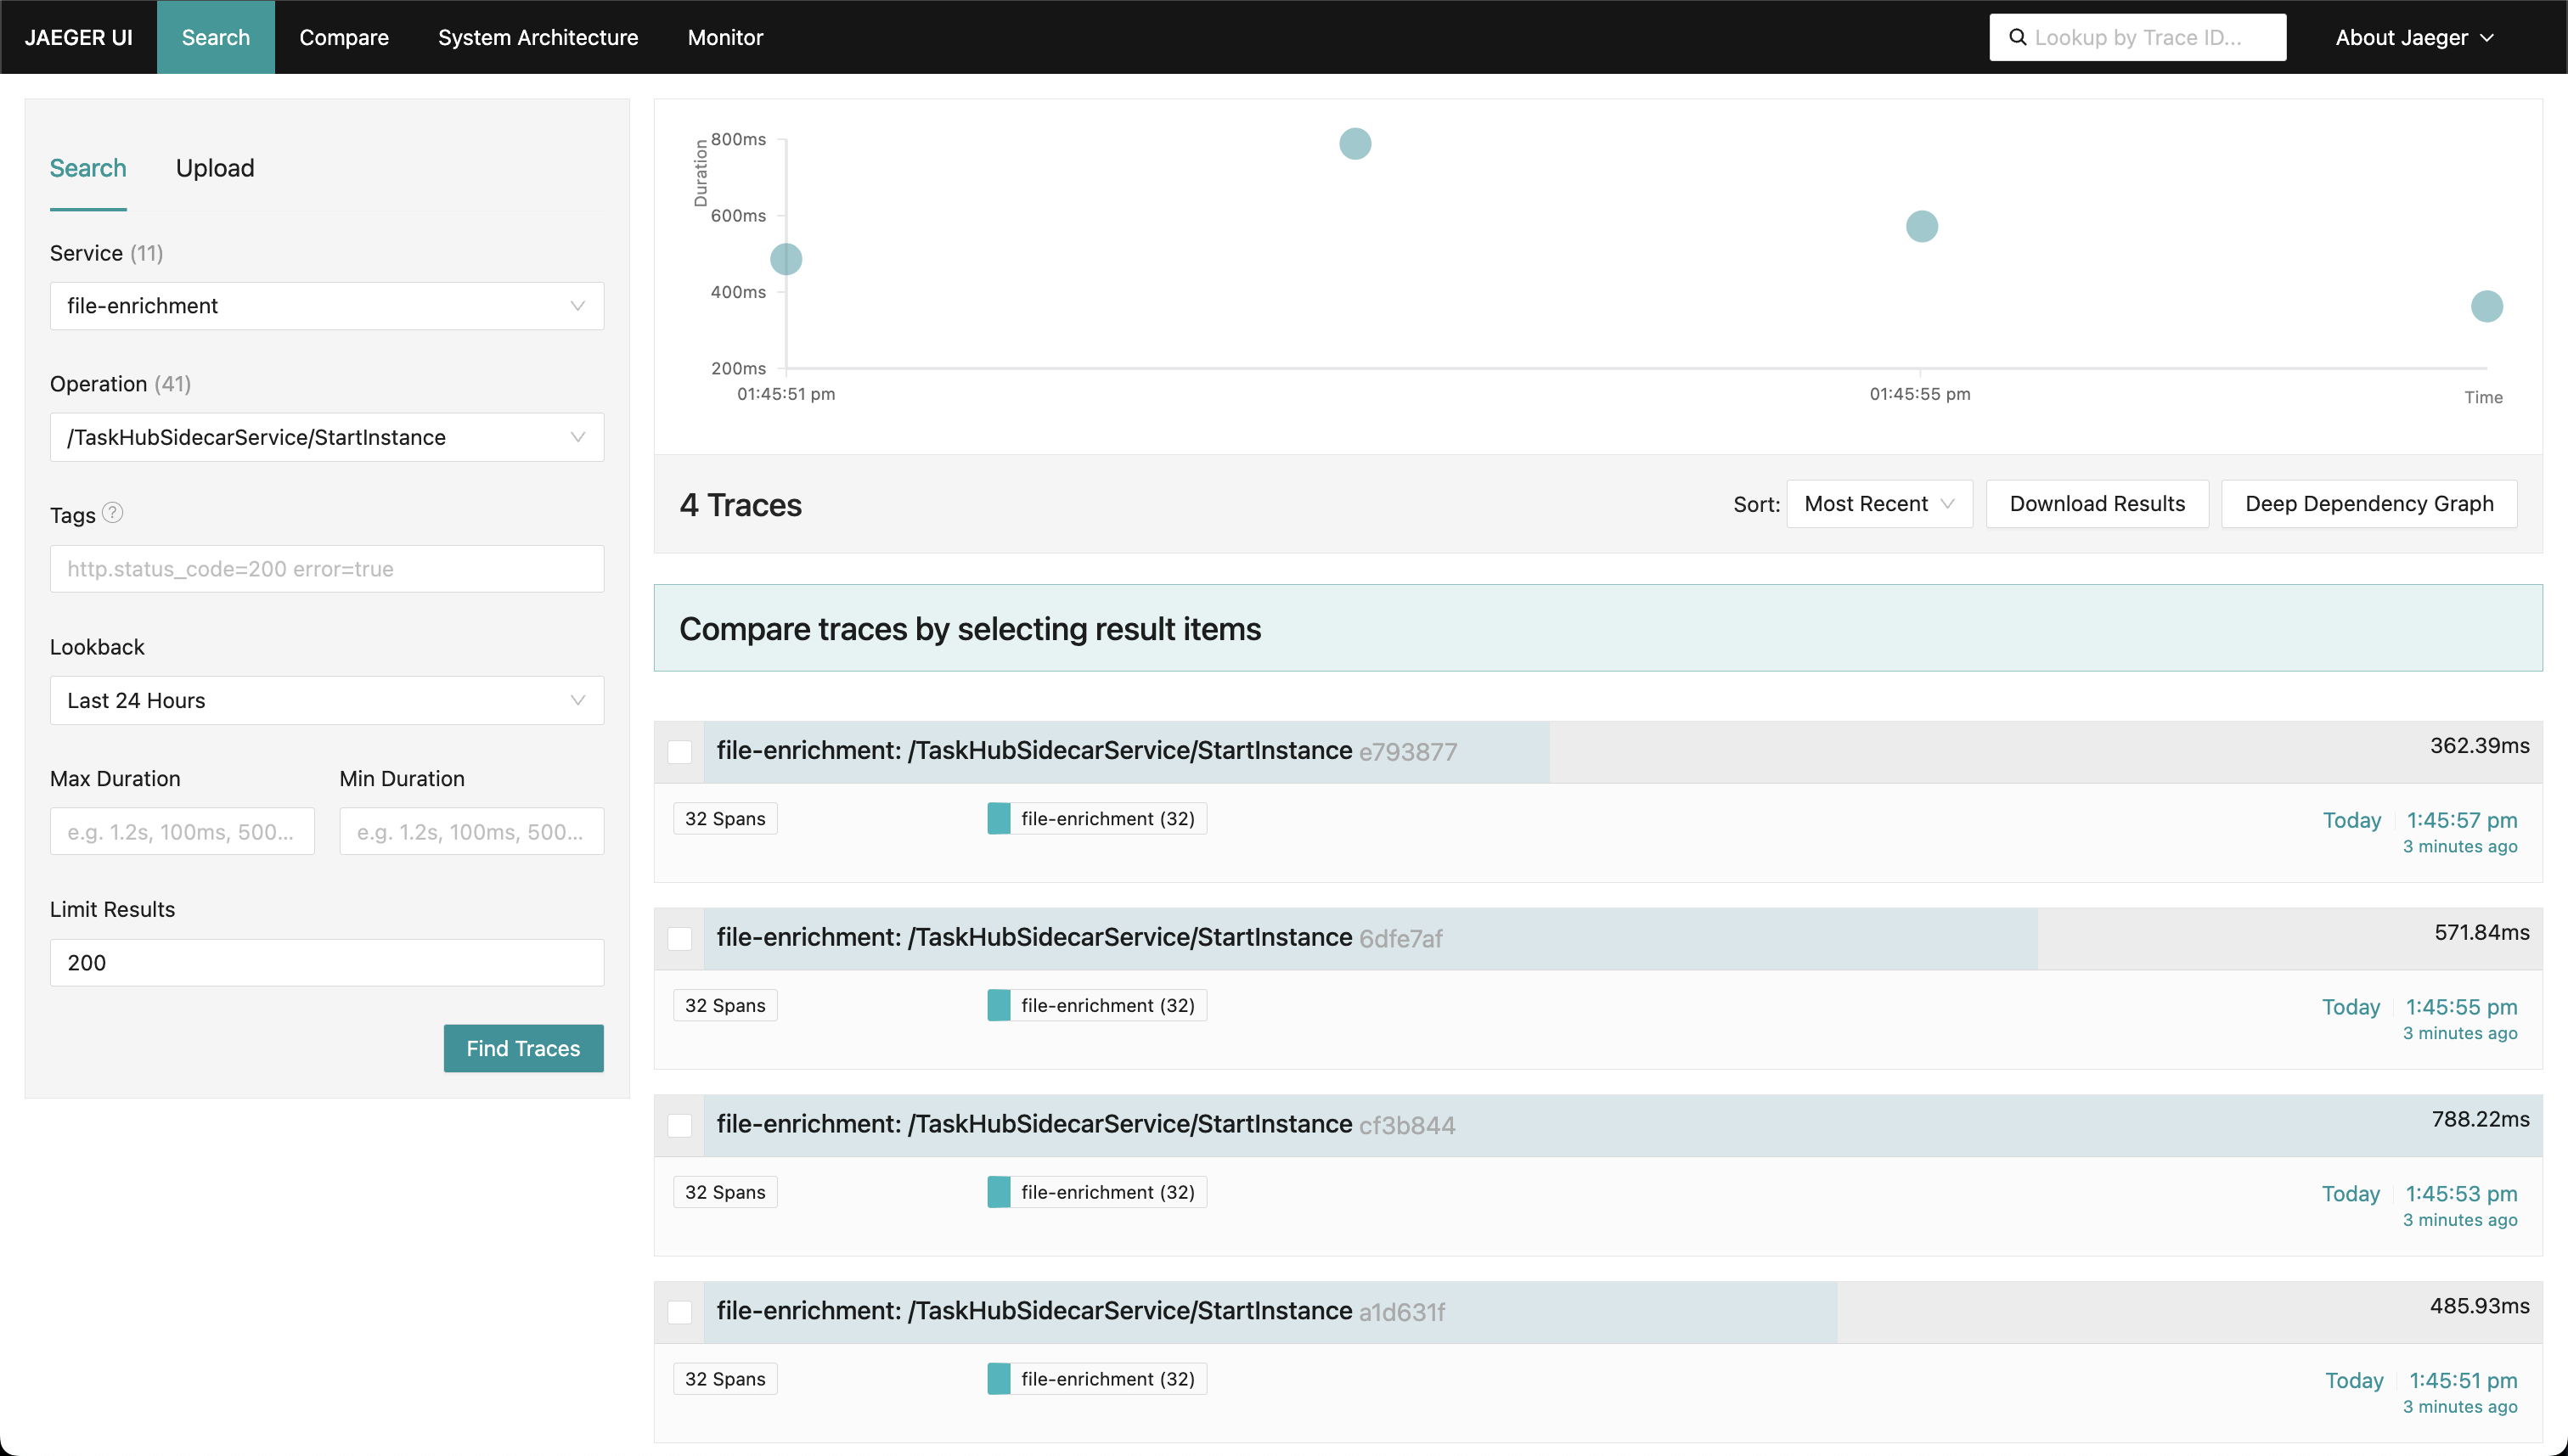
error=true:
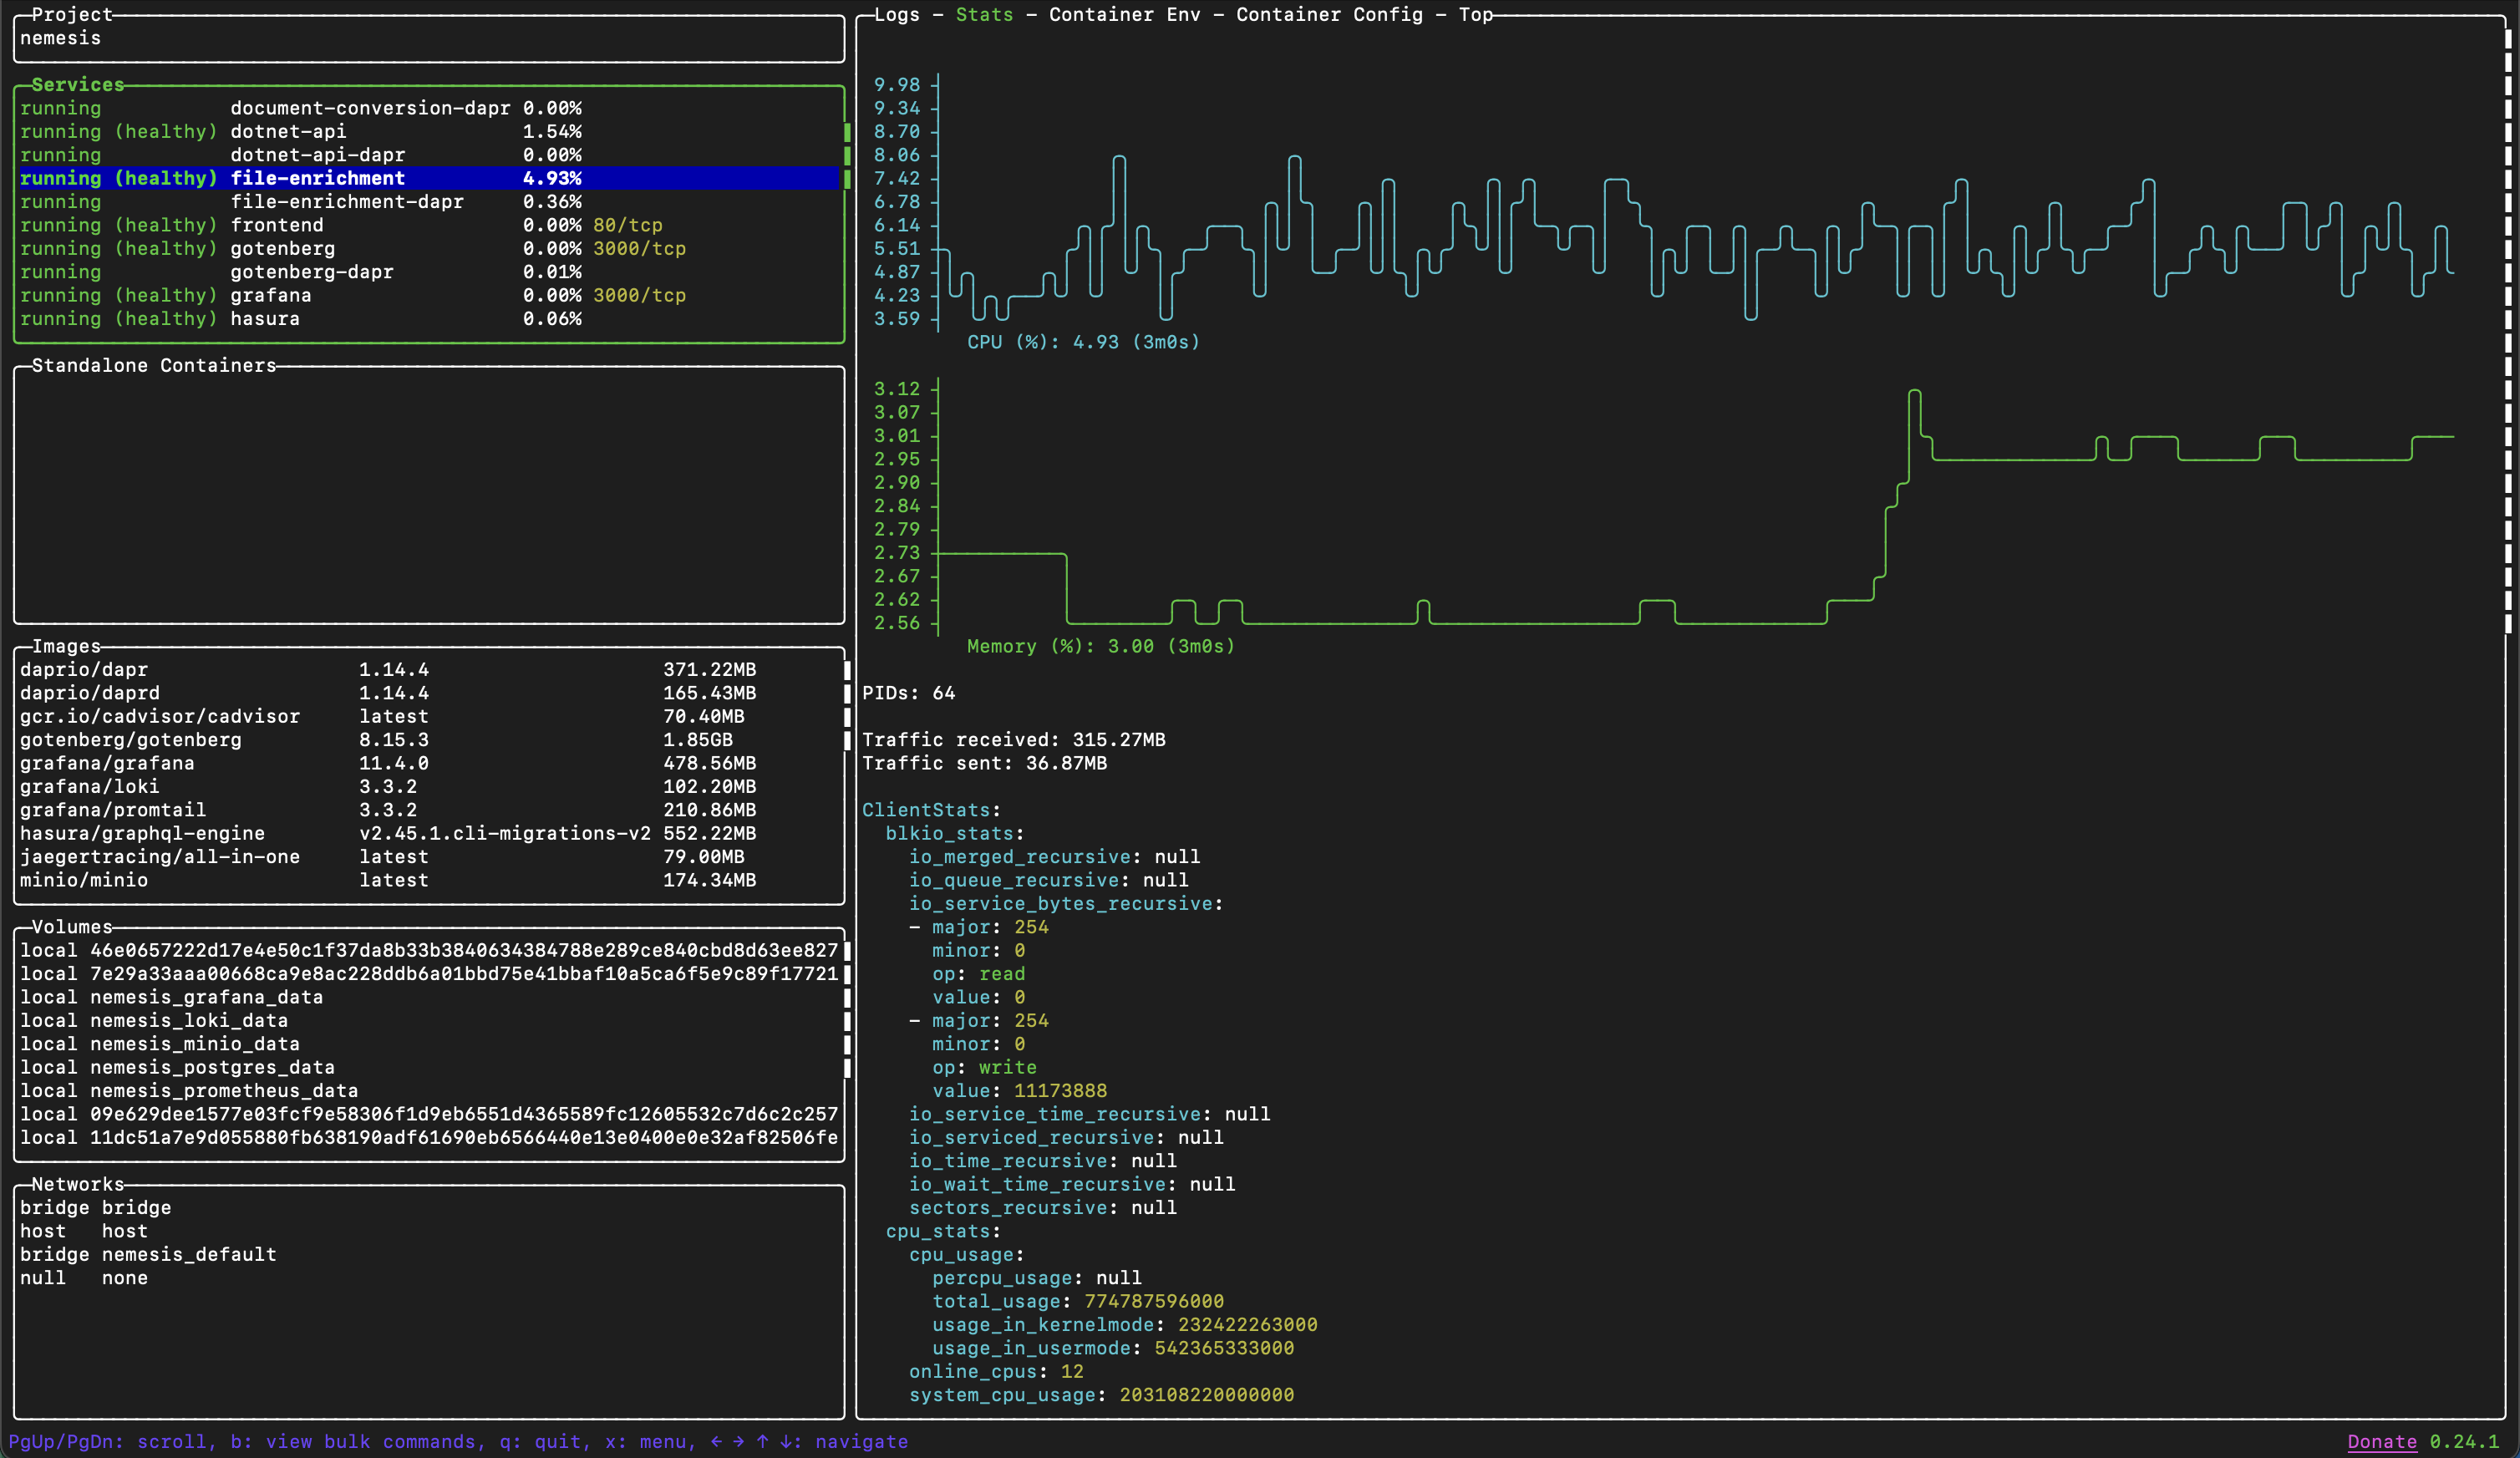
Lazydocker
While Lazydocker is not a Nemesis specific project, we highly recommend it for general troubleshooting when using Docker containers: